
Project: CRO
What you’re working towards
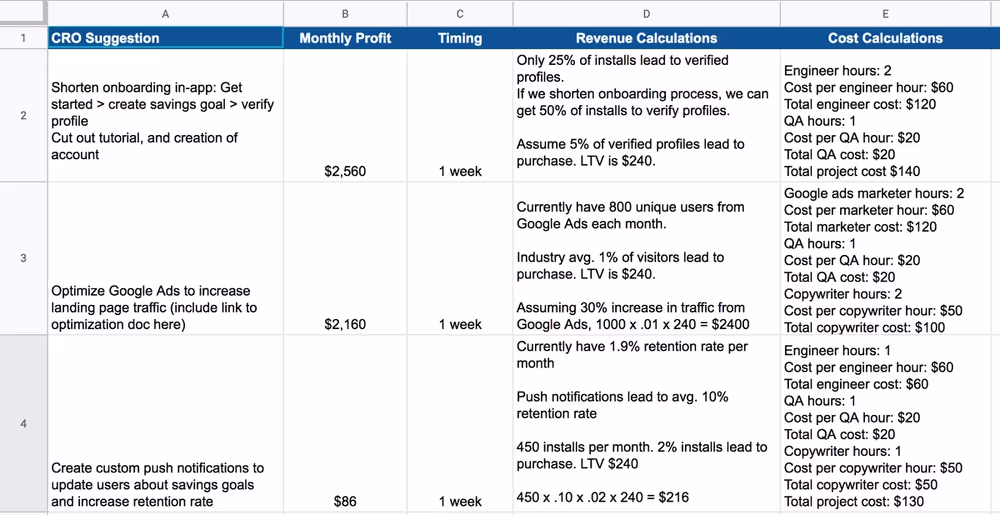
We’re going to end up with a spreadsheet that looks roughly like this.
The goal here is to illuminate the most important thing to work on that will lead to the most profit in a reasonable amount of time.
Overview
At a high level, we’re going to:
- Get data on the major steps of your funnel
- Figure out which steps of your funnel drop off most
- Systematically deduce why people dropped off at those points
- Brainstorm fixes
- Prioritize what to fix first
Let’s get started.
Phase 1: Walk through your funnel
How do we know what to work on? We need to know how to fill out Column A of that spreadsheet, to start.
First, make a copy of this spreadsheet.
Scroll right. You should see a section that looks like this.
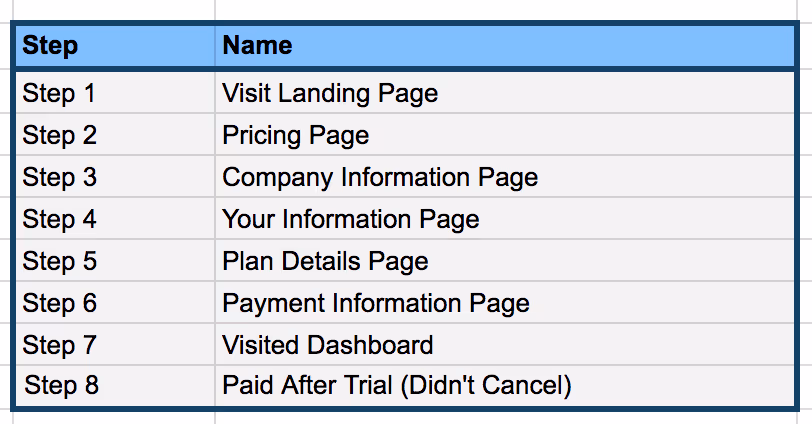
Go to your website and pretend to be a customer, listing out every major click you make and page you visit.
At minimum, you have to include what mechanically has to happen to get to a purchase.
For example, you can’t purchase without adding credit card information. You can get to the credit card screen before entering shipping info. You have to add to cart before you check out. And so on.
For each step, add it to the spreadsheet. Your list should end up looking like this.
Sometimes, there are tons of different paths a user could take to buy your product. For example, they may click different pricing plans and see different pages afterwards.
These are "forks" — like a fork in the road where people continue down different paths.
Make separate spreadsheets, group steps together, or ignore these forks altogether if they converge to the same next step. We can look at them later if we find a big drop-off after a fork and want to drill down.
Phase 2: Fill in the data
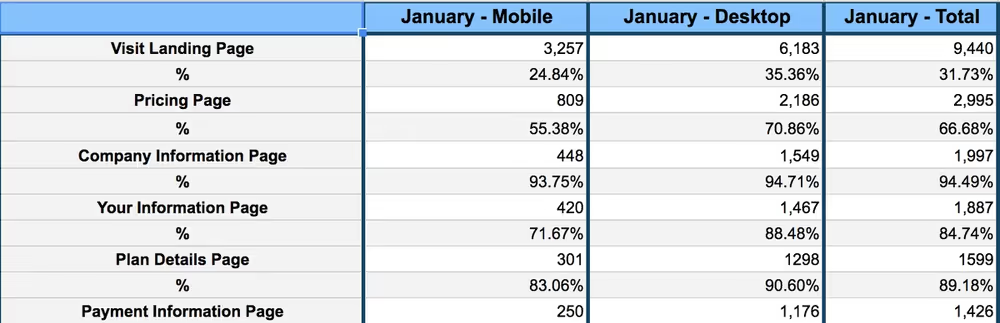
Next, you need to see how many people actually got to each step. Fill in the spreadsheet with how many unique people got to each step.
Output
You’ll want to end up with something that looks like this. Make sure you pull data over periods that last at least two weeks. You don’t have to pick a specific month like below.
How?
Most likely, you’re going to find these numbers in GA (Google Analytics). Now’s a good time to make sure you’ve done our reading on it.
They may also live a few other places:
- Your analytics tool: Mixpanel, Heap Analytics, Amplitude, etc.
- Your backend (the thing the engineers work on)
- The place you get paid: PayPal, Stripe, the physical checks in your file cabinet, etc.
Sometimes, you’re not tracking these steps in the first place. In this case, the best next step is to add a task for your engineering team to start tracking them.
Phase 3: Figure out which parts of your funnel drop off most
Look at the spreadsheet you made.
Focus on the % rows and find the ones with smallest percentages (meaning the biggest drop-offs). Find significant drop-offs between time periods as well — we’ll explain what these are below.
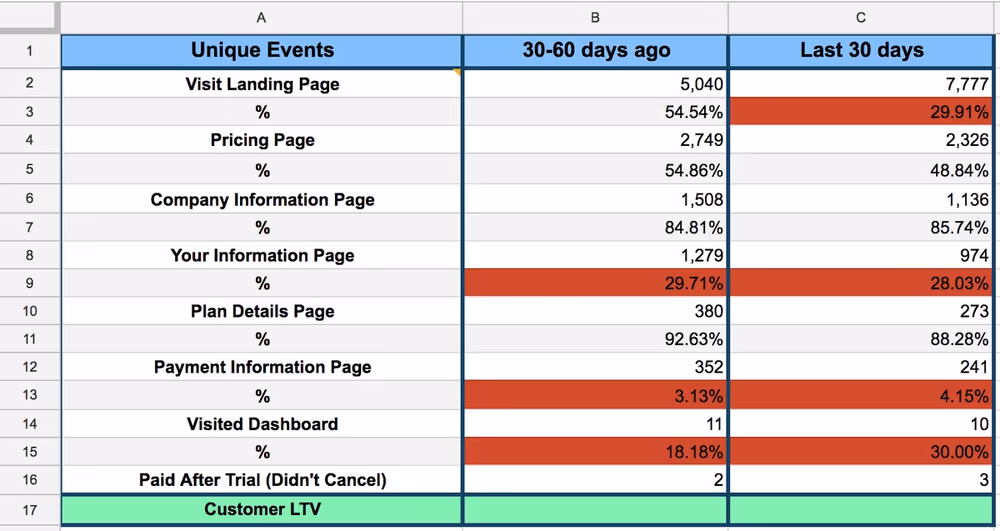
Color all these drop-offs red.
Here's an example.
Row 3 has a large drop-off between periods. Rows 9, 13, and 15 have a large drop-off relative to the rest of the funnel. These are the first places you should look to fix.
You can also compare to industry standards. One common example: if you’re a SaaS app and you have a free trial, and you ask for a credit card up front, you should expect about 40% of people who add their credit cards to convert. If you don’t ask for a credit card up front, you should expect about 1% of people who start the trial to convert.
Why look for the biggest drop-offs? That's where you can make the biggest impact.
Here's an example.
Let's say that 1000 people visit your signup page, but only 100 actually click "Sign Up". You could maybe get 20 more people to sign up with some smart tweaks.
That's a 20% improvement (120 people). Plus you still have 880 people left to catch.
Now say that 1000 people visit your signup page and 990 of them sign up.
There's no way to get 20 more people to sign up! You'd be at 1010 people. So even if you made some changes, you'd barely be able to get more people to sign up.
Conclusion?
Look for where there's more dropoff. You'll be able to make a bigger dent.
Make a list of the top steps in your funnel that people are dropping out.
Phase 4: Systematically deduce why people dropped off
Once you've found the places your visitors are dropping out the most, figure out why they're dropping out.
Marketing teams tend to explain drop-off the way they know know: they think they need to market a product better to explain why people aren't converting. But, usually they need to debug.
Very few teams know to debug first. Even fewer know how to do it well.
Here are the steps you should take to try to figure out why visitors drop out. In order of priority.
- Make sure the data is accurate
- Walk through the site
- Check for mobile issues
- Look for anomalies
- Spy on real users
- Check your gut
- Segment By Source
- Run User Surveys
- Look for feature releases
- Traffic source (custom landing pages that match keywords)
1. Make sure the data is accurate
Make sure that you're actually tracking what you think. This is something you can usually test. Quickly.
For example, Google Analytics has a "Real-Time" tab where you can see it register pageviews and events as they happen.
On your site, click a button that you're tracking. Or visit a page you care about. Then quickly tab over to GA and make sure that you can see it show up.
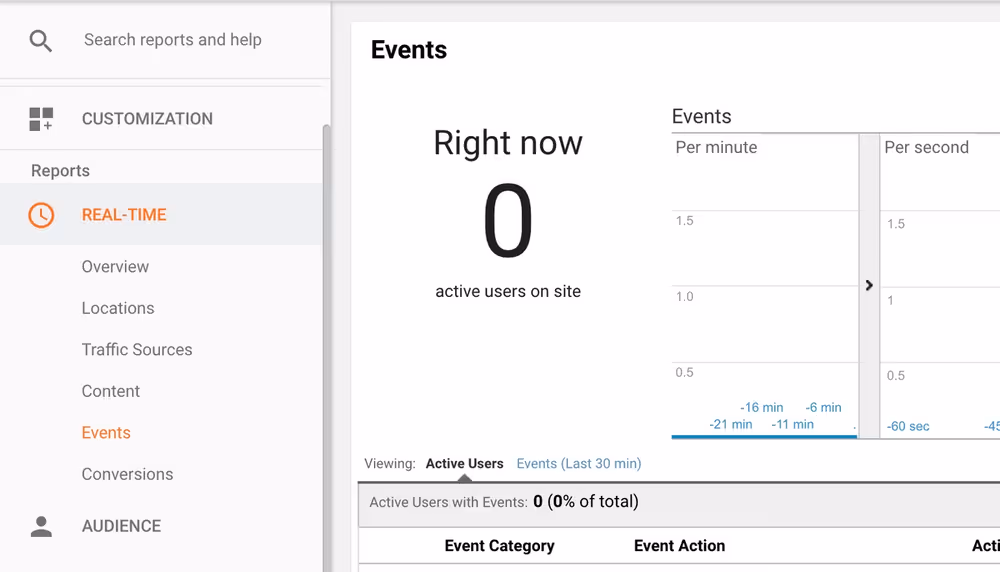
Make sure it doesn't show up twice.
Google Tag Assistant can help you find bugs as well.
For example, if you’re sending people emails, make sure you're tracking the links in them correctly (we’ve seen our clients screw this up). Look at the number of links people click in MailChimp (or whatever tool you’re using), and compare that to the number of pageviews you see in GA from the same emails.
If you have a mobile app, double-check the traffic that goes to the app store page and compare it to the number of clicks you see on the app store button on your homepage.
Clients of ours have wasted hours analyzing data, only to realize they were gathering it wrong.
2. Walk through the site
Pretend you're someone who really needs to buy your product. Use Google Analytics data to figure out the most common type of person who visits your site.
You're going to have some blind spots because you look at your site so often. Change your environment so you experience the site in a different way than you normally do.
Borrow a friend's phone, use a different computer, use a different browser. This forces you to slow down and mentally process the site more.
Chrome extensions can conflict with other chrome extensions. Teams develop their sites on a giant monitor, but their real users use iPads. Links point to the wrong URL.
It happens. There are many ways it can go wrong.
- Click every link, button, and image
- Visit every page
- Visit on multiple screen sizes, browsers, and devices
3. See if it's a mobile issue
Go into Google Analytics or your analytics tool — wherever the original data lives for the part of the funnel you're looking at.
Break down the data by whether the device is mobile or not. Then see if there's a significant change in conversion rates.
This is the second most frequent issue we see.
4. Look for anomalies
Look at graphs of your data. Try to find anything that breaks the usual pattern or looks weird.
For example, we were looking at the funnel data for one of our clients and saw that conversion rates had plummeted compared to the previous month. This rang alarm bells.
When we dug into the data, we noticed something strange. There was a huge spike at one specific step of the funnel on November 7th.
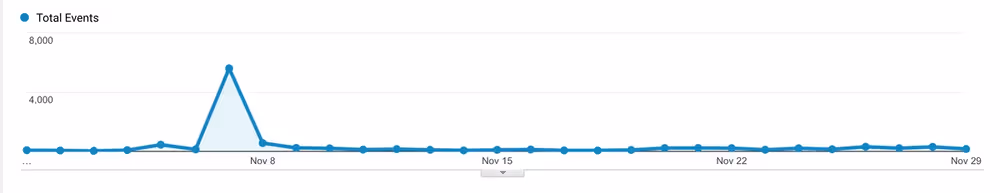
When we subtracted that out, conversion rates looked normal.
We still have no idea what it was — we thought it might be a bunch of bots. But we could be confident that potential customers weren't affected. There didn't seem to be a real issue.
5. Spy on real users
Install a tool like Hotjar or FullStory. These let you view recordings of real users as they use your site.
You want to watch the users who get to the page you care about, then drop out. See where their mouse goes.
See if their screen looks any different. Look at their age and job — do some googling and use LinkedIn to find that info.
See if you can find anything that would lead them to use the site differently than you do — that would make them get stuck.
Make sure you watch their whole session. (You can do it at double-speed to save time.) There can often be mismatches between what they see at the beginning and the end of their journey.
6. Check your gut
There's a reason we don’t put this first.
We’ve seen too many cases where people swear they know what the problem is, but there's really a more direct technical explanation.
But there is a time and a place for using your intuition. You know your users well, potentially better than they know themselves.
So go ahead. Guess what the problem is.
Then, see if the data matches up with the story you're telling yourself.
If you think your newly redesigned homepage is hurting conversion, look at the conversion rates before and after the page got redesigned.
Tease out conflicting explanations.
Maybe your redesign happened right after the holiday season and people were clicking more before. Because they were shopping for presents.
Maybe they didn't care about your design at all.
7. Filter by source and medium
What do the conversion rates look like, depending on where a user came from? Did they come from a Facebook ad? A cold email?
This secondary dimension in GA will help.
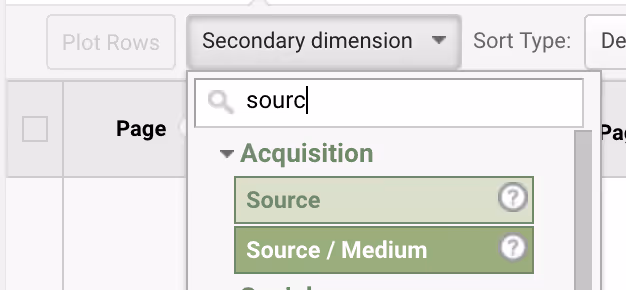
Once you figure out the sources and mediums that tend to convert better, scale up the ones that work and cut out the ones that don’t.
8. Run user surveys
If you're looking late in the funnel (close to the purchase) and have something like Mixpanel installed, you should be able to see the real email addresses of the users who are getting stuck.
Email them yourself. Ask them why they didn't keep going. Expect anywhere between 15-30% reply rate.
If it's under 50 people, try to interview them on the phone.
Be honest that you're trying to make the product better and saw they were interested — and you want their advice.
We have a separate project on surveys you can reference if you end up running with this idea. (It's in the Conversion README.)
9. Look for feature releases
Look at the log of the recent changes you made at that section of the funnel. Your engineering team should be able to help you out here.
Here's what happens a lot: we narrow down that a change got made (like a page getting redesigned). We undo that change and conversion rates jump back up. But we don't know why the redesign made things worse.
That's totally normal. Confuse correlation with causation. It will save you money to go back to what works.
Phase 5: Brainstorm fixes
Use what you’ve deduced from the previous phases to brainstorm ideas for what to fix. Then, look through our reading on conversion fixes and see if anything applies.
Your mindset should be, “what is fundamentally stopping people from converting?” instead of “how do i make this page more enticing?”
Phase 6: Prioritize what to fix first
There are tons of shiny objects to start working on. How do you pick the most important one?
There are only three things you need to consider.
- Cost: How much will it cost to make this change?
- Revenue: How much revenue will this change make us?
- Timing: How soon can we make this change?
You can't answer these questions exactly, of course. But you can use some quick math to get a ballpark.
Make a copy of this spreadsheet and add each of the major fixes you want to make. You should end up with something that looks like this.
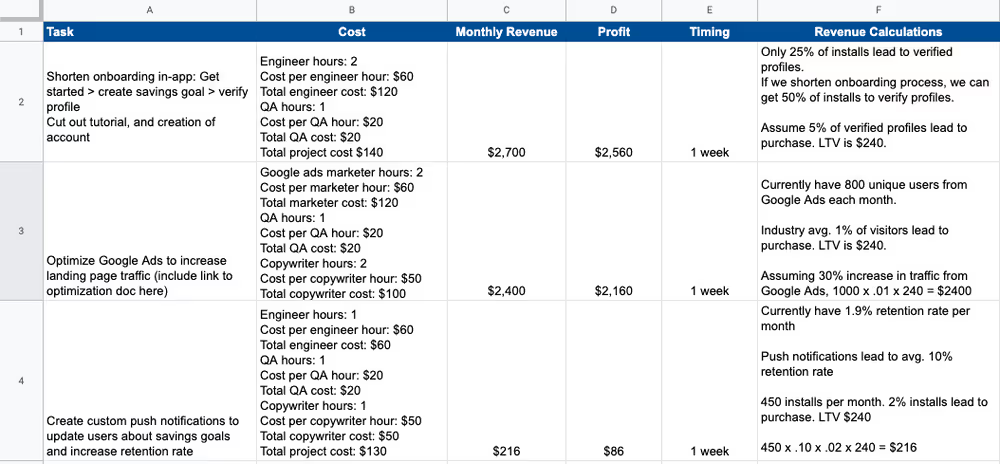
Let's break it down.
Cost
To get at the cost, take the salaries of the employees you'd need, figure out how much they cost per hour, and multiply that by number of hours it would take.
Add in anything extra you might need, and add a buffer of 1.5x the amount of time for bugs, testing, and management overhead.
Here are some examples:
Example 1: Make the landing page mobile-responsive
- Designer hours: 2
- Designer salary: $80,000 per year
- Cost per designer hour: $40 (80,000 / 50 weeks per year / 40 hrs per week)
- Total Designer cost: $80
- Engineer hours: 10
- Cost per engineer hour: $60
- Total engineer cost: $600
- QA hours: 1
- Cost per QA hour: $20
- Total QA cost: $20
- Total cost: $700
Example 2: A/B test removing four form fields
- Engineer hours: 2
- Cost per engineer hour: $60
- Total engineer cost: $120
- QA hours: 1
- Cost per QA hour: $20
- Total QA cost: $20
- Total cost: $140
Revenue
Estimate how many more customers you would expect from improving that step of the funnel. Use your funnel data.
Figure out how many people aren't converting at that step, and what percentage of those you think you could convert with that fix.
If you really have no idea what impact a change will have, a rule of thumb is a 30% improvement (assuming you have room in the funnel to improve that much).
There can be cases where you have a good idea of how much actual revenue you'll make. You can usually back into a number.
For example, if you have a list of 15 phone numbers of people who signed up, and you know exactly why they're not buying, you could have the CEO call them personally after the fix is implemented and expect to convert at least 5 of them.
Timing
Pretty self-explanatory. Estimate how long you think it will take to actually make the change.
Profit
Roll everything up into monthly profit (revenue minus cost).
Phase 7: Get to it!
Start implementing your first change.