Conversation


🥳 Feedback Received!
Thanks for taking a moment to share your thoughts — it genuinely helps us make each chapter sharper.
What happens next:
- Your feedback goes straight to our product team.
- We’ll use it to refine lessons, clarify examples, and make the program even more useful.
Appreciate you helping make this program better for everyone.
Ready for your next challenge? 👇
Introduction: Heatmap Analysis
Questions answered in this module
- How do I see how users are using my site?
- Where are my website visitors clicking? How far are they scrolling down the page?
- How do I know what to change on my site to make it easier to use and convert better?
- How can I source ideas for A/B tests?
Intro
This is a heatmap.
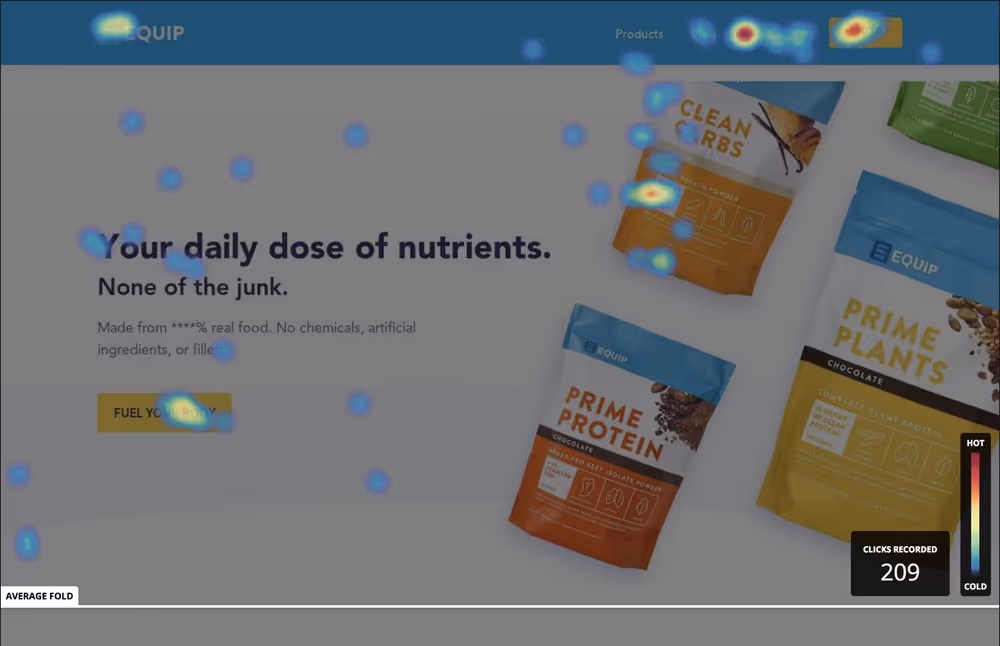
Heatmaps are pictures of how people use your web pages. With them you can see where they click, how far down the page they scroll, and where they moved their mouse. It does this in a “hot” and “cold” representation, where hot colors (oranges and reds) show a high density of clicks/movements, and cold colors (blues and greens) show a low density of clicks/movements.
In the example click heatmap above, we can see that the “Shop” button in the navigation received a ton of clicks (it has warmer colors). As did another nav link, the Equip logo, and the “Fuel your body” button.
In this module you’ll learn how to use heatmaps to make your site easier to use. So you can convert more visitors into customers.
What are heatmaps used for?
Google Analytics and Heap/Mixpanel/Amplitude don’t tell you the full story of how a visitor uses your site. They’ll tell you things represented by numbers: how long someone spent on your page, how many pages they visited, which actions they performed (e.g. sign up or purchase).
However, they don’t show you the exact parts of the page your users clicked, where they hovered their mouse, and how far down the page they got. Heatmaps do.
Heatmaps show you how users interact with your website, and let you identify parts of your site that are confusing or turning people away. You can then make changes to these parts, and start up a new heatmap to see if the changes made a positive impact.
You should use heatmaps whenever you want to improve the conversion rate and usability of pages on your website, such as any marketing pages, homepages, pricing pages, about pages, and more.
How often should I do them?
There are a few situations you’ll want to run a heatmap:
- You’re testing a new page or page variation
- This will let you see how this page is being used by users and how it can be improved
- You’re testing a new traffic source
- You can target heatmaps to a specific traffic source (like Facebook ads). This lets you test whether this specific traffic source responds differently.
How can I create them?
Hotjar is a great tool for making heatmaps and user recordings for your websites. It also has a free tier which suits most of our needs (even as an agency).
There are alternatives, such as Crazy Egg, Inspectlet, Lucky Orange, and Mouseflow. Feel free to do your research to find one that suits your specific needs.
We’ll teach you how to use Hotjar. After that, we’ll dive into how to read the results of your heatmap, which should be equally applicable to any tool you use.