Conversation


🥳 Feedback Received!
Thanks for taking a moment to share your thoughts — it genuinely helps us make each chapter sharper.
What happens next:
- Your feedback goes straight to our product team.
- We’ll use it to refine lessons, clarify examples, and make the program even more useful.
Appreciate you helping make this program better for everyone.
Ready for your next challenge? 👇
Project: Heatmap Analysis
What you’ll be working with
In this project, you’ll create heatmaps for your site and turn them into action items to improve the usability of your site.
If you’re running your own business or product, or have your own personal website, then run your heatmaps on that.
If not, you’ll walk through the motions of setting up a heatmap, and we’ll supply you with a sample heatmap for you to analyze and provide action items for.
Final deliverable
At the end you’ll create a document that summarizes the findings of your heatmap analysis, including relevant and interesting statistics, your interpretations of them, and actions items to improve the page based on your findings.
For an example of what it can look like, pop open our example deliverable.
Phase 1-2: Set up and install Hotjar
Hopefully, you did this when you set up conversion tracking. If you didn't, follow the instructions in the Hotjar UI to install it.
Phase 3: Create a heatmap
Once your account is created and the pixel is installed and verified, you’re all set to start the heatmap on the key pages of your website. For now, let’s run one on your homepage.
- Go to Heatmaps
- Click + New Heatmap
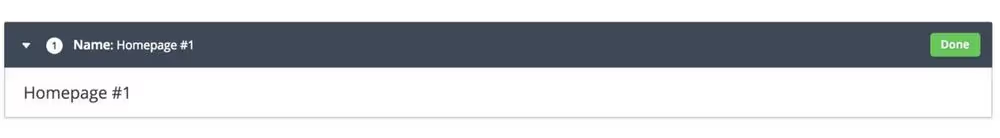
- Name: Homepage #1
- You’ll want to name it something easy to understand, such as a combination of the page name and the number of heatmaps you’ve completed on it. Examples:
- Homepage #1
- Product page #6
- Pricing page #2
- You’ll want to name it something easy to understand, such as a combination of the page name and the number of heatmaps you’ve completed on it. Examples:
4. Number of Pageviews: 1,000
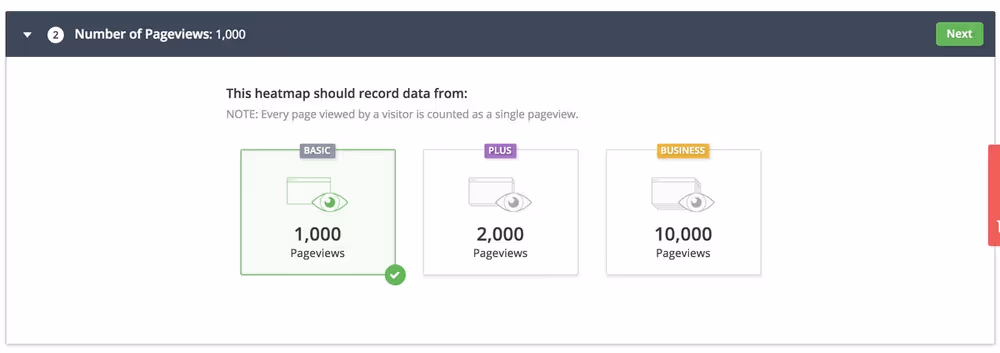
- If you’re using a Plus or Business account, you’ll be able to choose 2,000 or 10,000 page views, otherwise you’re restricted to 1,000. Choose the highest you can.
- The more results you have, the more statistically significant all of your results will be.
- However, choosing a high number also means you’ll have to wait even longer before you get results. If your site (or just this particular page) doesn’t get much traffic, you could wait weeks to get 5,000 page views. The good news is that you can view the results at any time, so there isn’t any harm to choose the highest # possible.
- Note that your page views will be split across the three device categories; desktop, tablet, and mobile, so this will cut down on the statistical significance even further.
5. Page Targeting:Visit a specific page – Simple URL Match – https://[yourdomainhere.com]]
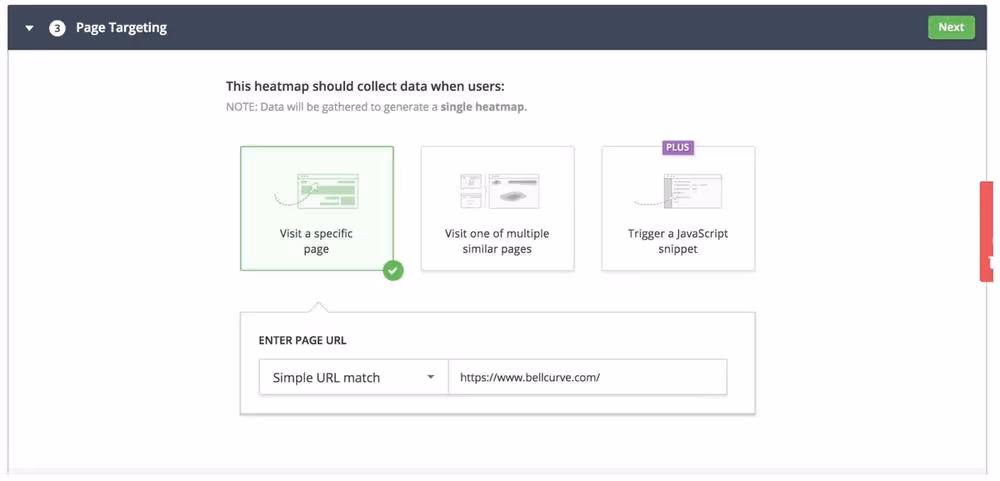
- Example: https://www.demandcurve.com
- This is where you choose which pages you want the heatmap to run on. There are a few ways to trigger it:
- Specific pages where you define the URL exactly (think homepage, pricing page, or marketing pages)
- One of multiple similar pages (like blog posts or product pages). This will select the first one someone visits as the sample.
6. Advanced options
- Exclude elements from heatmap
- If your site has any popups or overlays that may ruin your heatmap, you can tell Hotjar to hide them by specifying them by their CSS selector (ask an engineer). This is recommended for any site with popups.
- Custom screenshot page URL
- Heatmap data is normally overlaid on a screenshot of your site as taken based on whatever the first site visitor saw. If you instead want to specify this background image, you can put its URL there. We’ve never had to use this.
7. Click Create Heatmap
8. Wait for results to roll in
- The duration of this will depend on your website’s daily traffic and the number of results you set as your max.
- You can get Hotjar to alert you via email when the heatmap is complete, but you can also set yourself a reminder for a few days to come back and use preliminary data to continue on to the next phases.
Phase 4: Analyze your heatmap statistics
Open up this template and make a copy of it.
Here you’ll report on interesting statistics, add links to the heatmaps, and list insights and actions items to improve the usability and convertibility of your site.
Process of analysis
Once you have enough views on your heatmap, you’re ready to start analyzing the results.

We’ll analyze each of these heatmaps starting from largest device to smallest, and looking at each heatmap in turn.
Although you can learn a lot by just looking at each individual heatmap type (such as a click heatmap), they’re most useful when used in tandem. So you’ll want to go through them all with the other heatmaps in mind. We’ll dive into specific examples of when to do this throughout this phase.
4a High-level statistics
Start filling out the template by listing out the number of views and clicks per device.
You’ll also want to export a JPG version of the heatmaps and link to them for easy access to anyone who reviews these docs.

Don’t look at the total number of clicks as being a true indication of the “click” conversion rate for the page. Remember that someone can click numerous times at random on the page, and even on the same link. Use your analytics software to determine whether the page is getting enough CTA clicks.
Then as you go through the heatmaps, you’ll want to list out any interesting statistics in the “statistics” section. Include all of the following:
- The percentage of people before and after each major page section
- The percentage of people left at the bottom of the page
- Number of and percentage of total clicks of:
- All elements that receive a significant number of clicks (> 5%)
- All CTA’s
- Any elements that receive clicks that shouldn’t (assuming there’s more than one or two)
Phase 5: Come up with takeaways
Use the statistics you listed in Phase 4, as well as the questions per heatmap below, to come up with a series of takeaways and action items. These actions items should be things you want to change on the page to improve its usability and conversion rates.
Phase 5a: Scroll heatmap
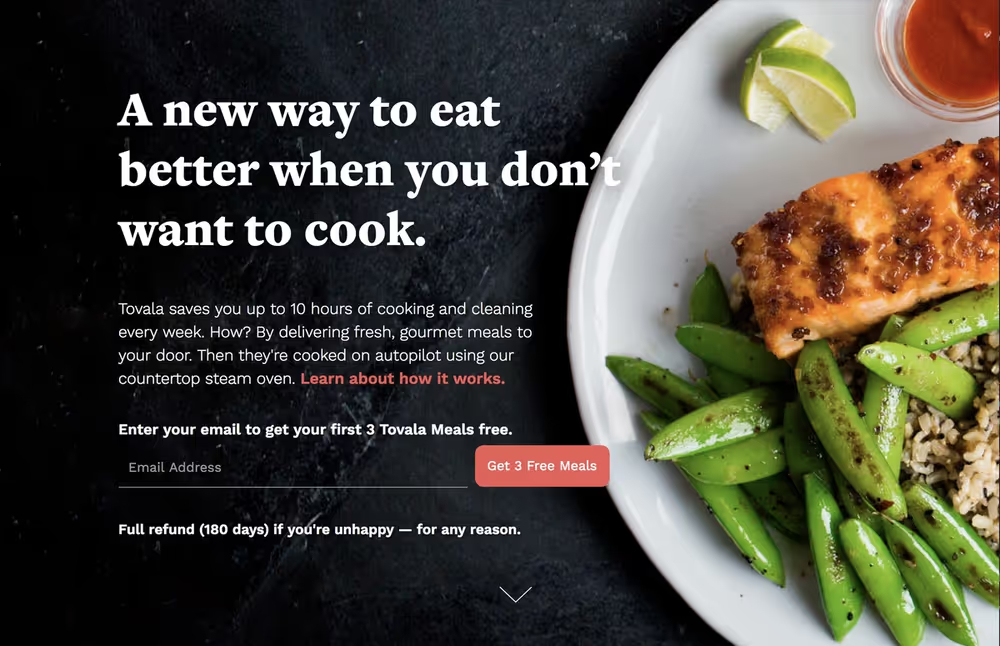
Does the “average fold” include all the main hero content that would give people a quick idea of what your business/product is?
The “average fold” is where the average site visitor’s screen ends when they first hit the site. The content that is “above the fold” is the site content that people immediately see when they arrive at your site.
The user should instantly be able to tell what your business and product is and why it may be useful to them (or if they’re not your target audience, let them realize that right away). The hero should tell them right away so they don’t scroll aimlessly trying desperately to figure out what your product is.
Make your hero or navigation smaller, or change the hero content if this isn’t the case.
Does the content above the “average fold” indicate that the page continues below the fold?
Sometimes people will need some sort of visual indication that there is more content for them to read, otherwise they may think that the page is purely what they see.
This can be achieved in a few ways:
- Content spilling past the fold, such as hero image
- A call to action in the hero that scrolls them to a section further down the page
- A hint of more content, such as the title of the next section:
- A small piece of text saying “scroll to learn more”
- Or a blatant arrow that points downwards:
Are the vast majority of people not seeing most of your landing page?
If people are clicking call to actions in the first half of the page, this could mean that it’s sufficiently compelling and getting them to click through.
But maybe they’re not converting when they get there. Or maybe they stop midway through the funnel. Getting signups isn’t everything. What matters are paid conversions from long-term customers. You can get poor quality signups if visitors create accounts before reading enough about your product (on our homepage) to know that you really are a right fit for them.
Sometimes you want to encourage people to read more of your page by removing call to actions early on the page, or making them scroll you to the next section to keep reading. This is particularly true for complicated SaaS products, or a new product category that takes a lot of explanation to understand its true value.
For well-established companies, this may just be current customers who know what they want, or are simply logging in. In these cases you’ll want to limit the heatmap to just show ad traffic so you can make sure you’re only looking at new users who may not have heard of you.
But if people are seeing little of the page and not clicking through, then it means something early on in the page is turning them away. See the next question to dive into investigate this further.
Is there a place with quick changes in color, indicating that a lot of people are dropping off at a specific part of the page?
Cross-check this with the click heatmap to see if they’re leaving by clicking a link or button in this section. Otherwise maybe something in the section is confusing people and turning them away.
You'll want to change the content at that point to see if it reduces drop off. Or change the call to action to make it stand out more, or change the call to action text to make it more compelling or more relevant to the section’s content. Other possible solutions are to move this section and put it later on. Maybe it’ll perform better after another section’s content.
Phase 5b. Click heatmap
Are your main call to actions receiving the majority of clicks? i.e. are the right buttons getting the right clicks?
Your primary call to actions (usually the big buttons near the top of your page or items in your navigation) should be the thing visitors click most on the page. If they aren’t, you’ll need to change your page.
If a CTA isn’t being clicked at all, and the scroll depth heatmap shows that a large percentage of people are still seeing it, then that section needs to be made more compelling, or the CTA needs to be more noticeable. This could involve redesigning or rewriting the whole section, or redesigning or rewriting the CTA itself.
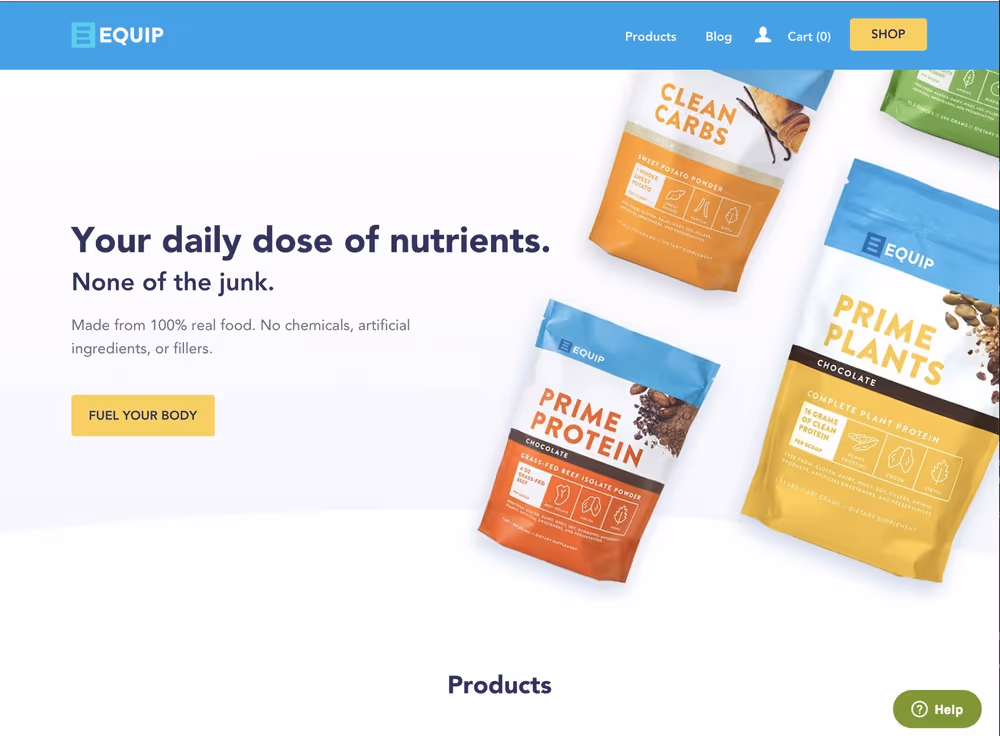
Is something getting clicked that you wouldn’t expect to?
An example is the Clean Carbs product in the hero for EquipFoods.com. It’s not a button, and is not intended to be clickable. Yet people click it.
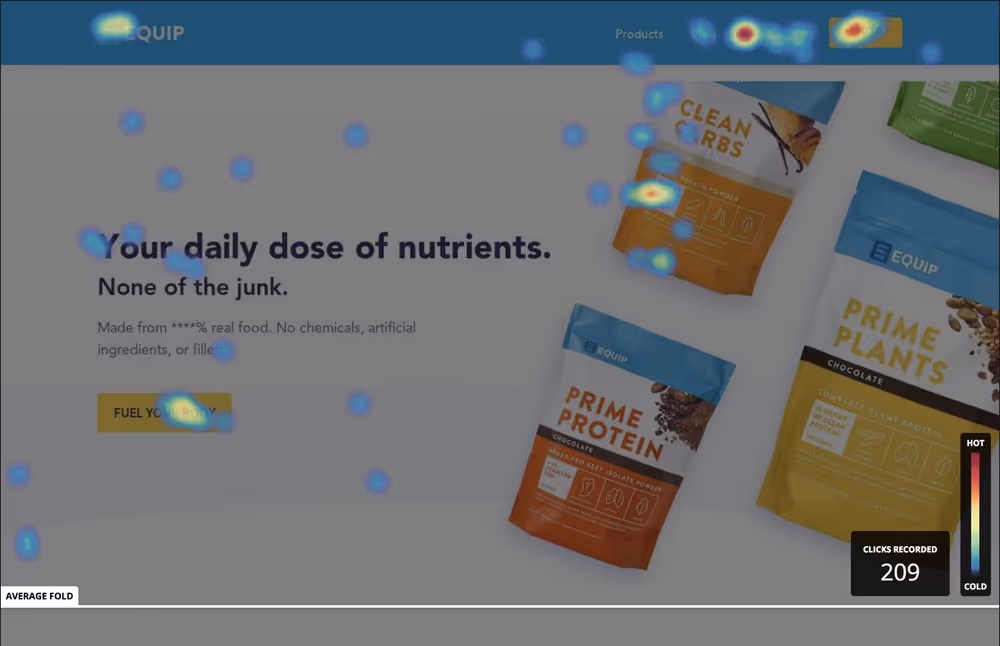
Is there something on your page people are clicking that they shouldn’t? Can you either make it clickable or change it so it isn’t enticing to click?
Important: People click randomly on the page all the time. We’ve seen this happen on every site we’ve run a heatmap on. Therefore, ignore any clicks on blank space or random words if there’s only 1 or 2. If more than 1 or 2 people are clicking something, then it could mean that word or element is leading people to believe it’s worth clicking.
Is a footer link getting more clicks than you would expect?
If the linked page provides additional information about the product or company, like an About page, Pricing page, or Product page, then consider adding the link to the navigation if it isn’t already.
Maybe people need the information on that page to feel ready to convert. Give them an easy pathway to get that information.
Important: Make sure that these pages have a clear call to action to either return to the landing page, or to move on to the next stage of the funnel (e.g. sign up page or product page) so visitors don’t get stuck on that page. Every linked page should be optimized for conversion.
Are you getting clicks later on in the page, or are they all concentrated in the first couple of sections?
This could be an indication that either your first couple of sections are sufficiently compelling to convince people to click through to convert, or it could indicate that you should remove call to actions from the first part of the page to encourage further reading.
You’re best to A/B test this change as it could either increase or decrease conversions depending on why people are clicking through. Maybe you already sold them enough, and removing the call to actions will just reduce click through rates. But maybe they just didn’t have enough context from the landing page to make the final purchase decision later. Only testing will tell you for sure.
Are there links in the navbar that people aren’t clicking?
This indicates that people don’t think that the information on that page is important to them, or at least not from reading this page.
Possible reasons for this:
- They feel they got the information they needed from the page.
- They feel it’s not important to them (like an About page for most ecommerce companies).
- They’re confused or turned off by the link text (be as clear as possible; Pricing, About, Products, etc)
- They feel they first need to see something else first, like pricing, or the product page before bothering to look at something like the About page. Check the heatmap on those pages to see if the link is more popular there. Also check your analytics tool to see if that page is being visited.
Is a testimonial or citation getting a large percentage of clicks?
If the testimonial links to another site, consider removing the link or removing the testimonial entirely since it’s causing a lot of people to leave the site. Or at least make sure that this link opens in a new tab and doesn’t replace your page.
If it doesn’t link to another site, this may mean people are interested in verifying the claim (maybe it’s a bold claim). Consider adding a link or removing the testimonial entirely.
These two pieces of advice are contradictory. We can never be sure what the user’s true intention was or what they were thinking at the time. We can only make educated guesses and test what happens when we change possible pain points.
Are the pages that people are clicking to optimized for conversion?
Every page linked to in the navigation or throughout the landing page body should have clear call to actions that take people further down funnel. You don’t have to do an intense sales pitch on every page if it doesn’t make sense contextually. At the very least you should include a section we call a “CTA section” that highlights to product and links to a sign up/product page, or asks them to sign up for a newsletter
If a lot of people are clicking to a page that isn’t optimized for conversion, you’re likely losing a lot of people on that page. Go into your analytics platform and look at the “exit rate” for each page that people are clicking to see if any of them are higher than average. That page should either be unlinked, or be better optimized for conversion to help eliminate this leak in your funnel.
Phase 5c. Mouse movement heatmap
Are there areas of high concentration of mouse movements, but very little clicks?
This is an indication that they wanted to click there but realized or thought they could not. It could be worth adding a link in this spot if appropriate.
Phase 6: Make changes
Once you’ve identified all the changes you’d like to make, and the elements you’d like to test changing, you’ll then want to go about implementing those changes.
But, depending on the change, you shouldn’t just immediately implement it and restart the heatmap. Sometimes you should A/B test the new version against the current version to see if it actually made a significant positive impact on conversion and site usage.
Deciding whether to A/B or not
Here’s how you should decide whether you should immediately enact the change, or to A/B test it
Change immediately if:
- Something is broken or not working as intended
- The average fold doesn’t include the entirety of the important hero content
- There isn’t a visual indication that the page continues past the fold, and the call to action doesn’t link them down the page. Add the indication, even if it’s a blatant arrow.
- The change is small, and isn’t likely to make 20+% changes to conversion, such as changing:
- Text on a button or other call to action
- Only a few words in a section
- A navigation link text
- Changing navigation links
- The color of buttons or links
- The size of images
- An image to another image
- A page element is being clicked or hovered over a lot when you didn’t have a link there. Add the link since people clearly want it there
A/B test the change if:
- The change is large and could have a significant impact on conversion (20+%), such as redesigning or rewriting a section, adding sections, or re-ordering sections
- You’re removing or changing call to actions, such as removing or changing CTAs that link to the product page in the first half of the page (to encourage people to read the content on the landing page before going further down funnel).
See our A/B testing module for more information on running A/B tests.
Phase 7: Restart heatmap/perform A/B test
Once the changes are implemented, then you’ll want to set up the next heatmap test on the updated page—even if you’re A/B testing it.
Repeat this process of creating and analyzing heatmaps to come up with more lists of action items and improvements. Do this on a page until you’re no longer learning from each test (or you stop using the page!).
Also run heatmaps on other pages of your site besides your landing page, and run them on any new page you come out with. Any and all pages can benefit from this analysis.