Conversation


🥳 Feedback Received!
Thanks for taking a moment to share your thoughts — it genuinely helps us make each chapter sharper.
What happens next:
- Your feedback goes straight to our product team.
- We’ll use it to refine lessons, clarify examples, and make the program even more useful.
Appreciate you helping make this program better for everyone.
Ready for your next challenge? 👇
How to Track Ad Performance
We’ve already dipped into Amazon ad reports—most notably in Step 5 of the campaign launch process, when we used the Search Term Report to find the highest-converting search terms. That’s the tip of the iceberg when it comes to Amazon metrics and reports. Below are a few additional ways to gain insights into your ads’ performance.
But first, a tip: Amazon’s performance tracking uses your account data. And your account data only goes back 60-90 days. We recommend putting these reports on schedule to download your data once a month as an .xlsx or .csv file, so you have a complete archive.
You can always download your data to Excel or Google Sheets to sort, filter, create pivot tables, and perform other data functions.
Performance dashboard
We’ll start with the first thing you see in your Campaign Manager: your performance dashboard. In your seller account, go to Advertising > Campaign Manager to see it.
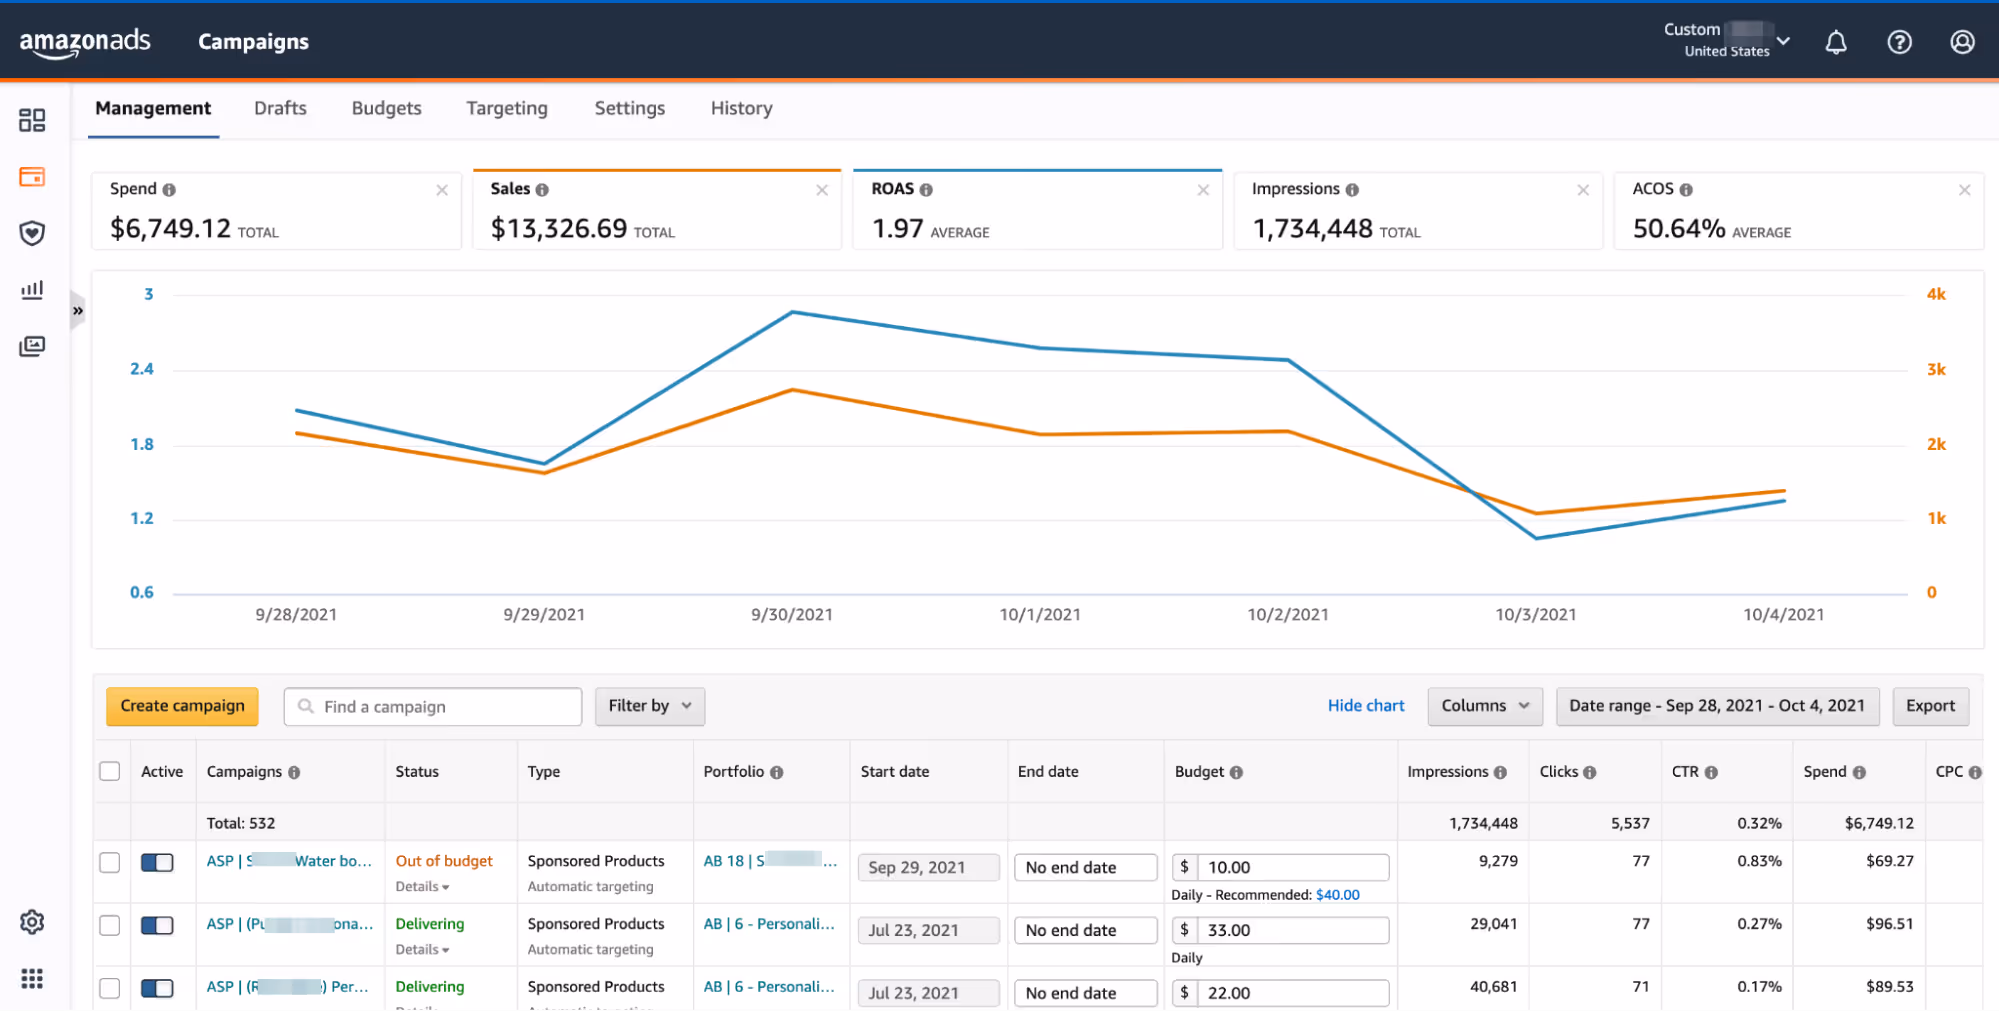
You can customize your dashboard by adding or removing metrics from the graph (a max of two can be viewed at once) or changing the date range, and you can click on individual campaign names in the table to have those campaigns appear in the graph.
Here are some of the metrics you can track in your performance dashboard.
*Top of funnel means farther from the point of purchase. Bottom of funnel means a metric is close to or at the point of purchase.
**Figures based on 2020 metrics from Ad Badger’s US user base of ~500 Amazon sellers
How to act on your performance dashboard metrics
Regularly—ideally on a daily basis—check your metrics to see how they’re performing in real time and in relation to past performance. If you start seeing a drop, consider where in the funnel it is. A top-of-funnel drop means your ads aren’t generating initial interest; maybe the issue has to do with keywords. A bottom-of-funnel drop might mean your product pages aren’t as enticing as they could be, your price is too high, or you need more social proof in the form of stronger reviews.
Advertising reports
You can generate reports by campaign by clicking on the Reports button on the left tab of Amazon Advertising. Because we recommend putting most of your budget behind sponsored product ads, the following are all sponsored product reports, although you’ll find overlapping or similar reports for brand and display ads.
(We didn’t include every report below. Some, like Performance Over Time, are less useful for optimization.)
Search term report
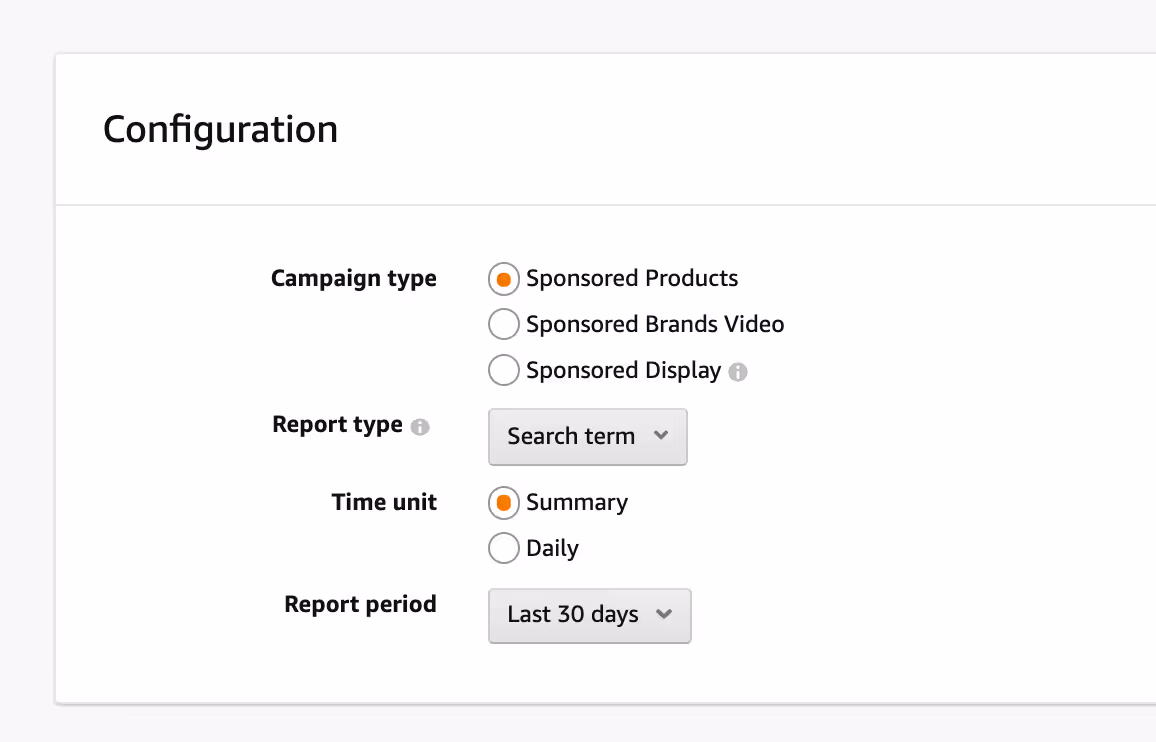
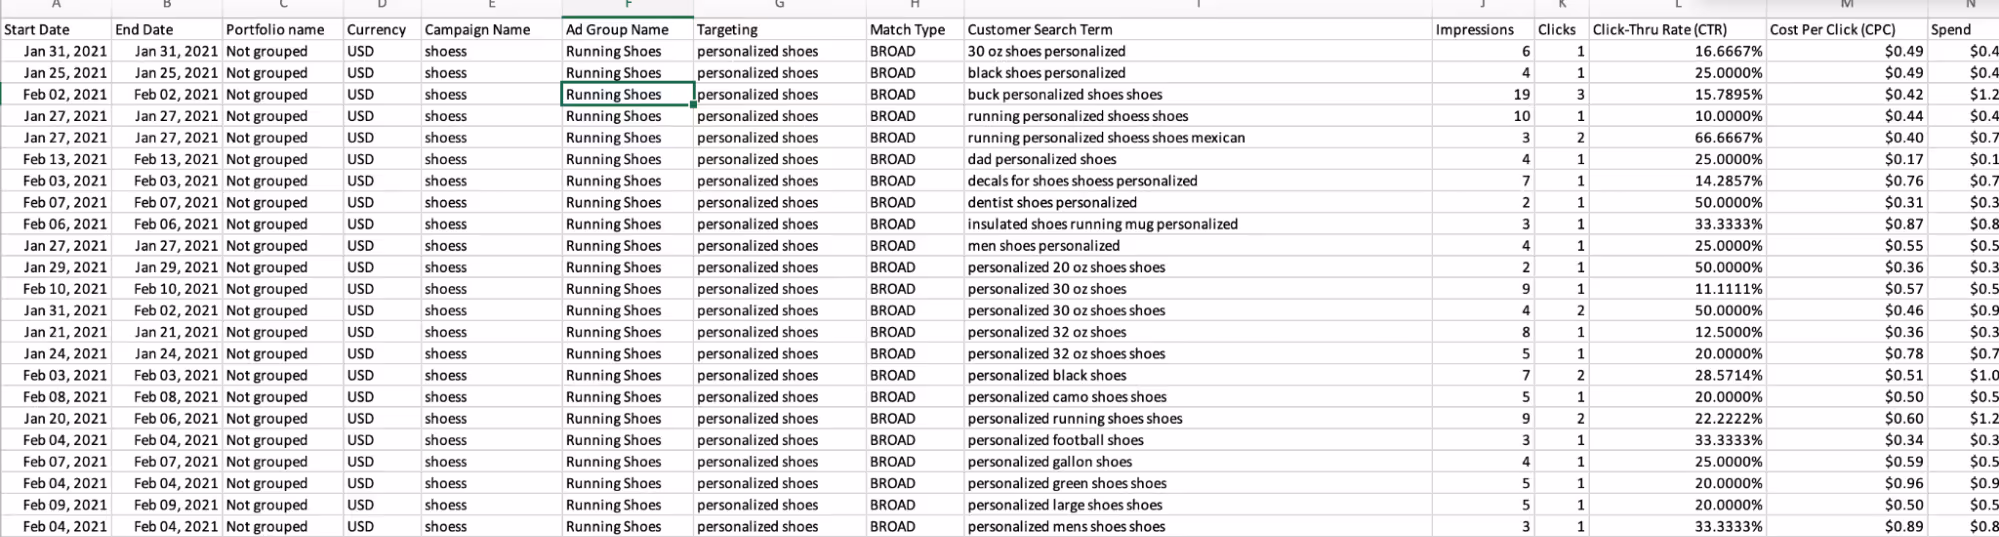
Metrics/elements tracked include: customer search terms, impressions, clicks, CTR, CPC, spend, ACOS, CVR
Use it for:
- Seeing which search terms are leading to discovery of your product
- Comparing real and target ACOS
- Carrying out the search-term gradation process, including optimizing bids and finding negative keywords
Targeting report
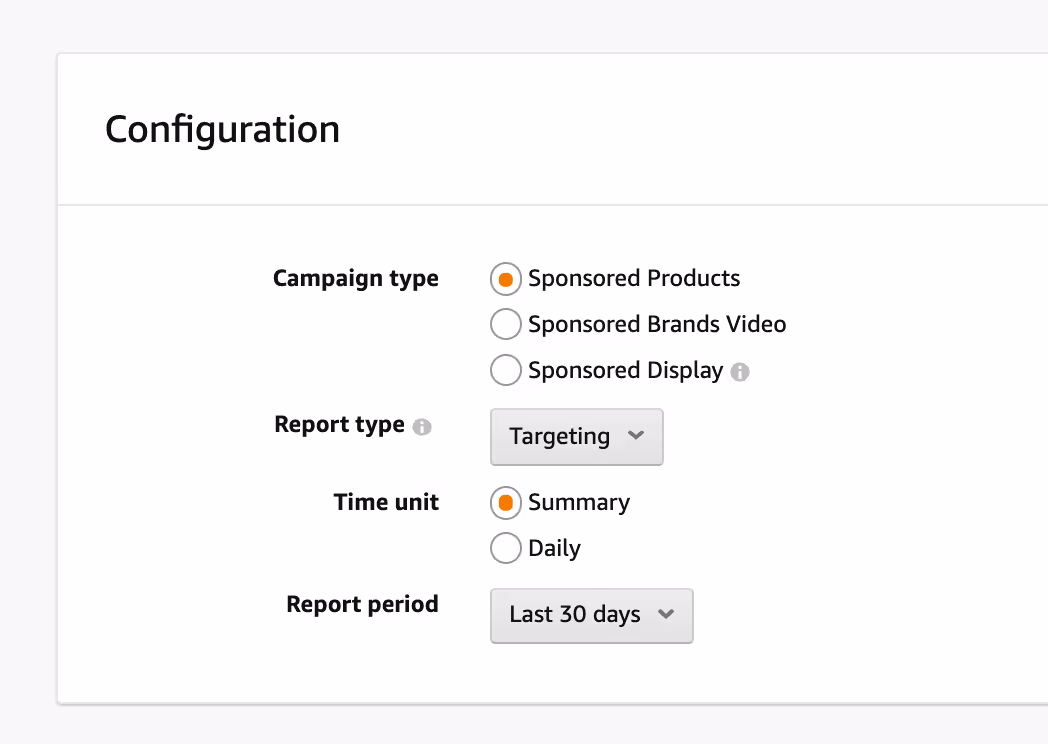
Metrics/elements tracked include: keywords, ASINs, and categories you’re targeting; match types you’re using; ROAS
Use it for:
- Seeing every keyword you’re bidding on, including duplicate keywords where you’re bidding against yourself
- Adjusting bids based on performance
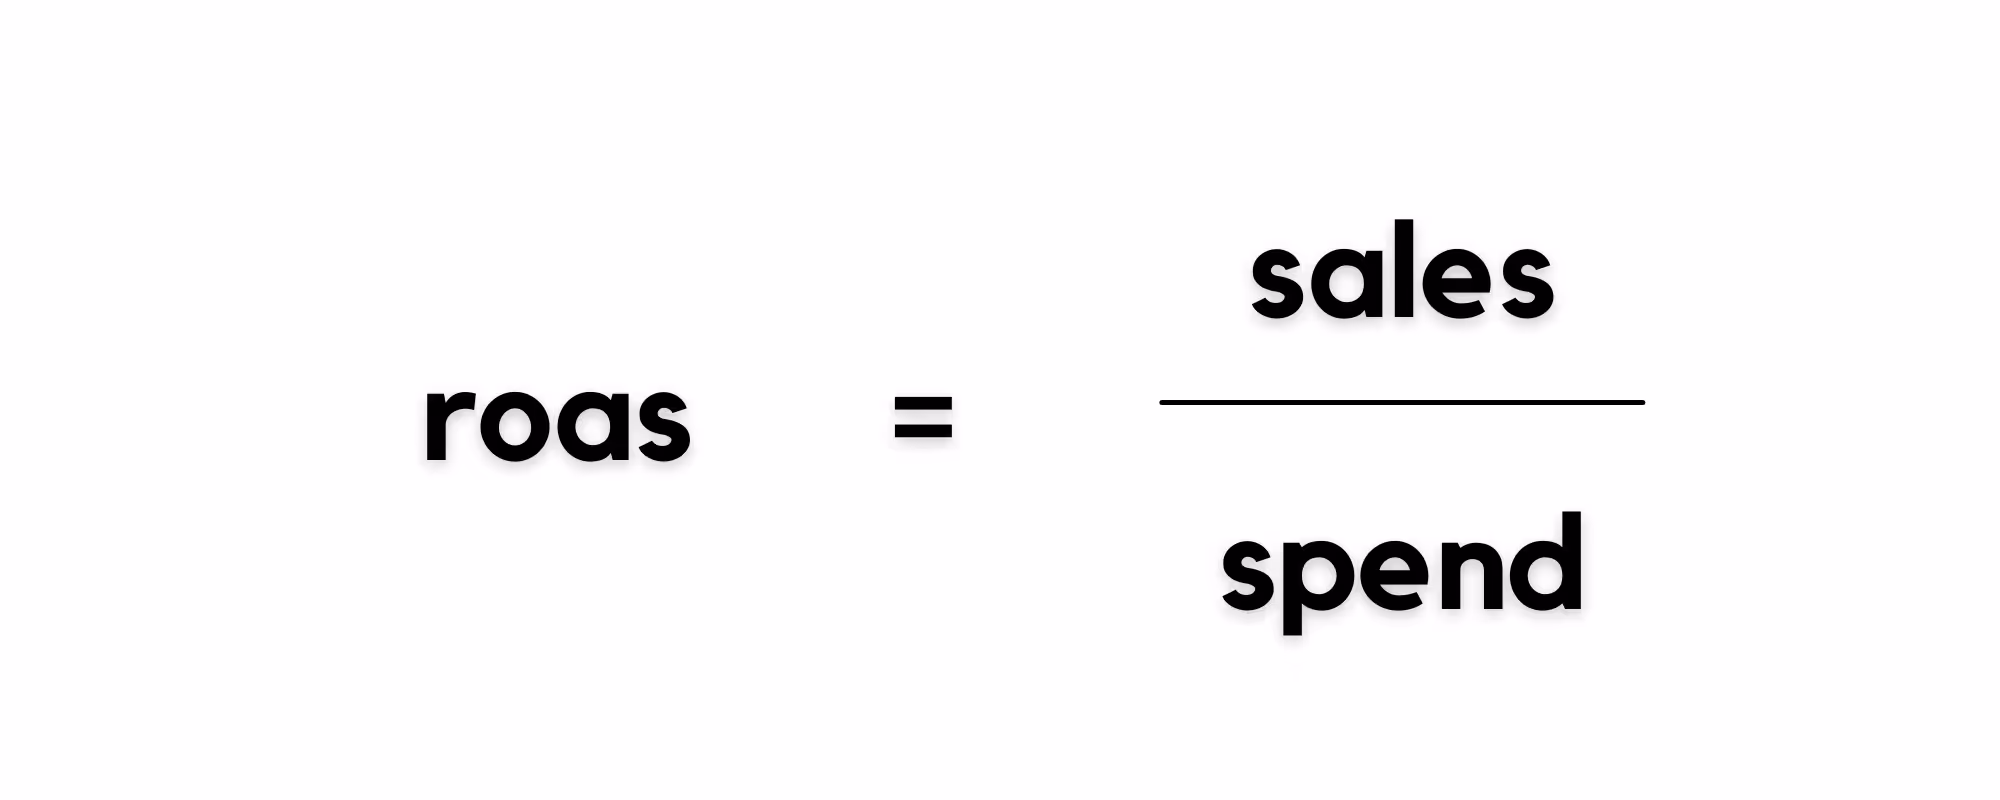
- Determining your ROAS, or return on ad spend: total sales divided by total advertising spend. ROAS is basically the inverse of ACOS.
Advertised product report
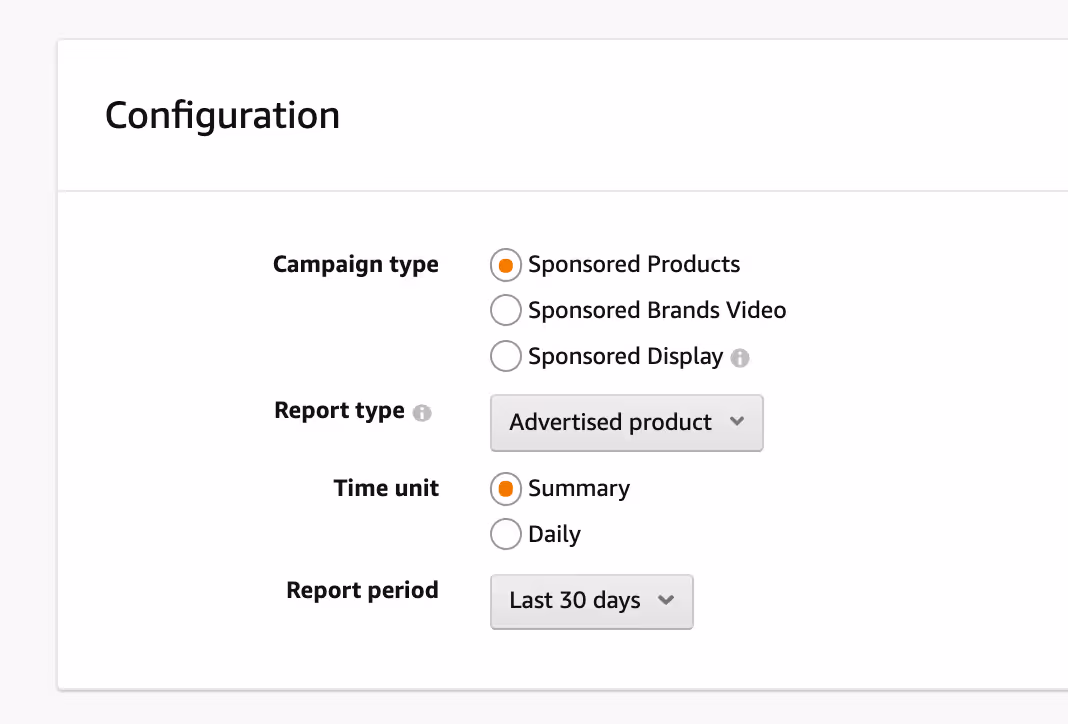
Metrics/elements tracked include: ASINs and SKUs arranged by campaign and ad group; impressions; clicks; CTR; seven-day metrics like sales, units, and CvR
Use it for:
- Seeing which products are getting the most impressions and clicks
- Checking past-week performance
Placement report
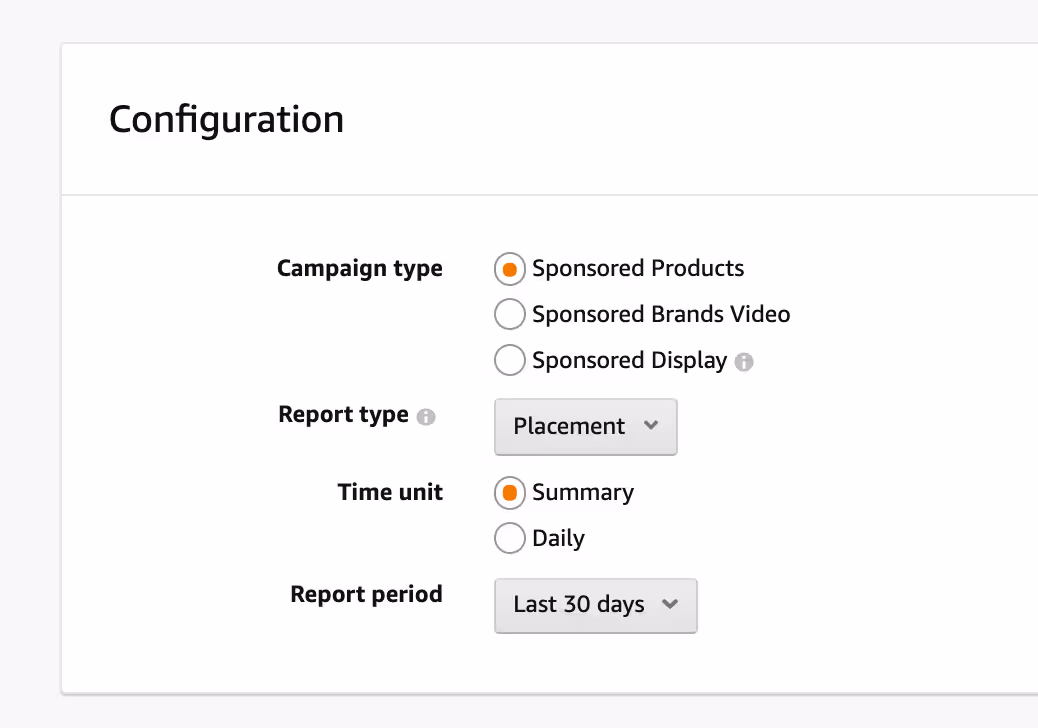
Metrics/elements tracked include: impressions, clicks, and CPC based on where an ad is placed (such as top of search results, rest of search results, or a competitor’s product page)
Use it for:
- Analyzing performance by placement to inform bids. If your product page ads have low CTR but your top-of-search ads are high performers, you may want to reallocate ad spend to invest more in top of search. You can adjust bids by placement in your seller account > select a campaign > Placements tab.
- Informing single-keyword campaigns
Purchased product report
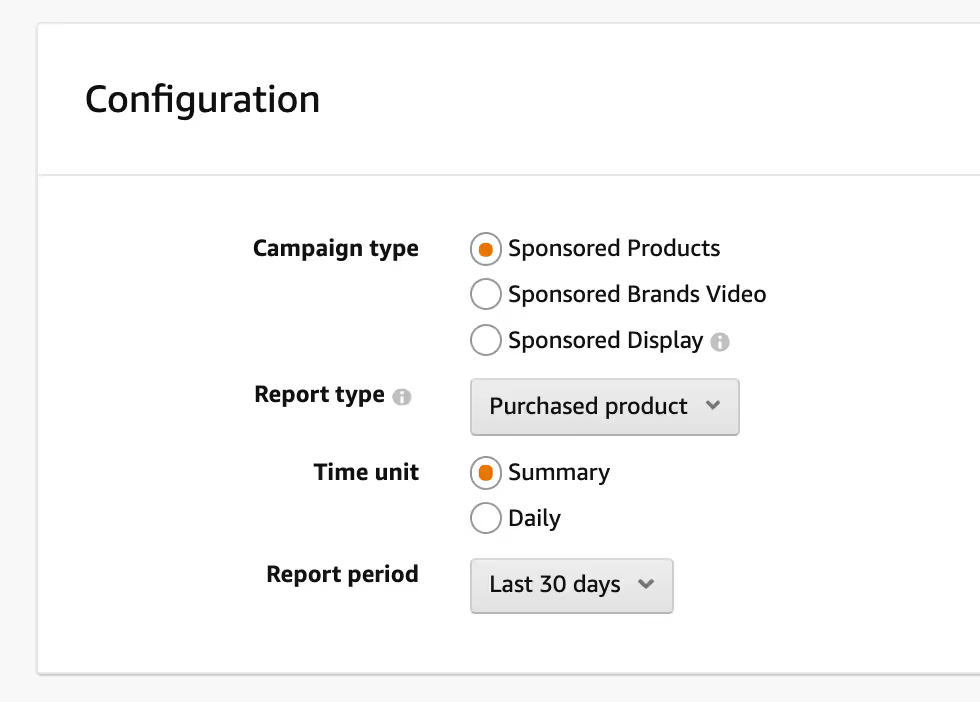
Metrics/elements tracked include: advertised ASINs, ASINs of the products that shoppers purchased, match types, targeting
Use it for:
- Seeing instances when a purchased product is different from what was advertised (meaning a customer saw one ad and bought another of your products)
Search term impression share report
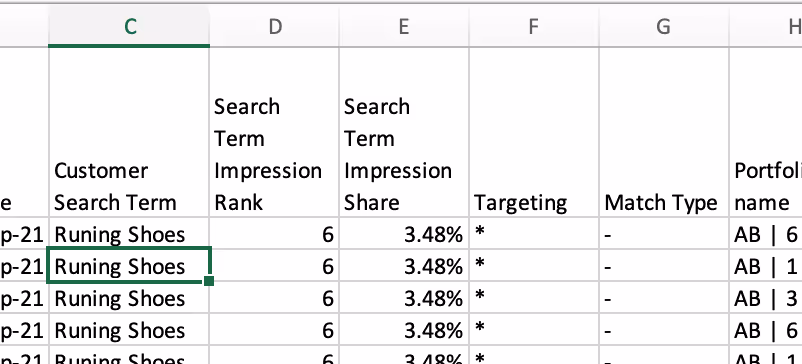
Metrics/elements tracked include: search term impression rank, search term impression share
Use it for:
- Determining your impression rank: how your impressions for a search term compare to other sellers’ impressions. A rank of 2 means you had the second-highest impressions for that term.
- Determining your impression share: the percentage of impressions you have for a search term. If a term has been searched 800 times and you have 80 impressions for it, your impression share is 10%.
- Deciding whether to bid higher on terms with low impression share and ACOS, or lower on terms with top impression rankings and high ACOS