Conversation


🥳 Feedback Received!
Thanks for taking a moment to share your thoughts — it genuinely helps us make each chapter sharper.
What happens next:
- Your feedback goes straight to our product team.
- We’ll use it to refine lessons, clarify examples, and make the program even more useful.
Appreciate you helping make this program better for everyone.
Ready for your next challenge? 👇
TikTok Ad Performance and Optimization
How to test TikTok ad creatives
In this section, we'll show you a straightforward creative testing methodology to find learnings faster and protect your core campaigns from creative flops (which will happen).
- First, create a separate ad set for each format, and test 3-6 creatives per ad set. Each of the creatives in your ad sets should be wildly different. You want to take big swings and find out what resonates in your broad audience campaign. After about three full days of spending, you'll have enough data to get a sense of what's going on and start iterating.
- Iterate on winners with hook testing. Since the first 2-3 seconds of video are the most important for hooking people, we suggest testing the hook first. With this approach, you'll test up to six different hook variants for one video asset in a new ad set. Here's the formula:
- Variant 1: Opening visual a + headline a
- Variant 2: Opening visual b + headline a
- Variant 3: Opening visual a + headline b
- Variant 4: Opening visual b + headline b
Example: True Classic
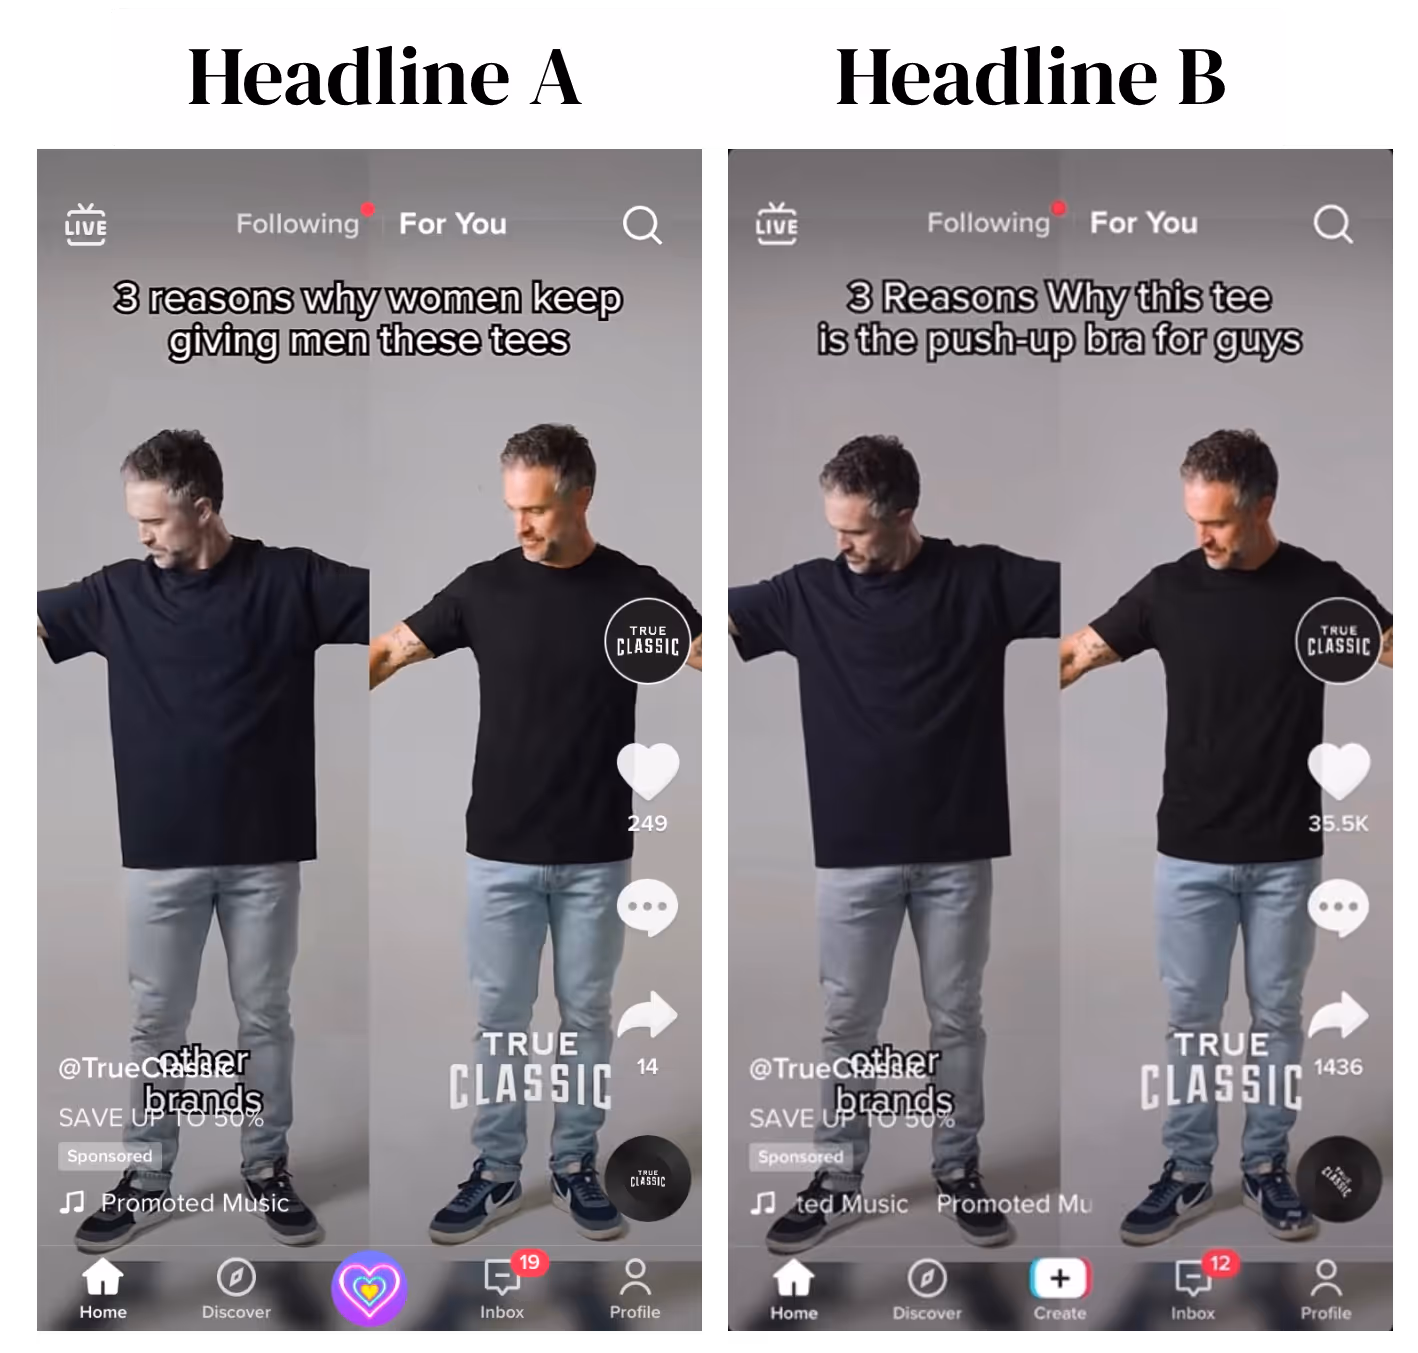
- The only difference between these ad variants is the "3 reasons why…" headline.
Here's an example of a big swing creative test using two wildly different video openers.
Example: Vacation
Vacation is an ecommerce sunscreen brand that supposedly sells "the world's best-smelling sunscreen." Look at these two different ad variants they ran for a single video (the first three seconds are entirely different).
Version A:
Version B:
The first scene of an ad is the most important, and by focusing on the lowest common denominator of video watchers (people who watch the first 5 seconds), you'll get actionable information that you can use moving forward to optimize creative performance further.
- Make a call after three full days of spending. After about three days of running a new test you'll typically run into one of the following scenarios:
- Results are excellent: CPA is lower than average, and there are at least one or two potential creatives in the ad set. In this scenario, start scaling spend by about 20% every three days directly in the creative testing campaign. You want to make sure the ad can withstand an increased budget before adding it to your core prospecting campaign.
- Results are average: Only a few purchases are generated, falling within 10% - 20% of your usual CPA targets in the account.
- Results are bad: CPAs are high (2x normal or greater) across the board, and there are little to no purchases generated from the new creative test. Turn those ads off.
Bidding and optimization
TikTok optimizes in similar ways as other paid social channels. Depending on the industry you're in, you can optimize toward different conversion goals.
According to TikTok's best practices, you'll need to sustain at least 50 conversion events per week to exit the learning phase. Until you exit the learning phase, you can expect higher costs and poorer results.
Once you're out of the learning phase and able to begin efficient optimization for bottom-funnel events (e.g., purchases), your CPA and ROAS numbers should predictably improve.
- Choose Lowest Cost Optimization: Same thing as lowest cost bidding on Facebook. You're not giving TikTok any specific bid for any event; you just want TikTok to find the lowest cost conversions while spending through your total daily budget if possible.
- Optimize budget at the ad set level: Set budgets at the ad set level (ABO) rather than the campaign level (CBO). This will give you levers to control spending and delivery by top-performing audiences and assets.
- Optimize for clicks and views to start: For the optimization process, you’ll need to begin with CPC or CPM to determine which users are most likely to click your ad before you’re able to move on to optimized billing models. After you’ve generated 50 events in seven days in any given ad set, you’ll be able to access oCPM or oCPC. For example, if you’re focused on app installs and want to optimize toward users downloading your app, you’ll first need to drive enough clicks via a CPC or CPM billing model to complete 50 installs before moving the billing event to focus on oCPM or oCPC.
Reminder: When testing different bid options, you need to let ads run for 3 - 7 days before making any changes. That's the time it takes for TikTok to accumulate data during the initial learning phase.
A few more ways to optimize your campaign settings:
- Bid for the goal you want: There's no trick here. Just select the CPA goal you're trying to optimize for and let TikTok do its work.
- If you find your ad sets aren’t receiving impressions after a while, it might be helpful to duplicate existing campaigns every few weeks to kickstart impressions.
- Avoid making bid changes greater than 20%, as this will reset ad set learnings.
Reporting
We’re going to keep this section brief. TikTok's ads manager offers custom reporting features just like Facebook. Ultimately, the metrics you focus on will be specific to your business.
Clicks and conversions are always valuable KPIs to watch when reviewing your TikTok Ads Manager data to see how successful a campaign was. These allow you to see how many people were compelled enough to click through and complete the action you intended via your paid ad.
TikTok's analytics make it easy to report on all of your primary metrics, albeit within a strict single-session attribution window. Here are some key sales and performance metrics for website traffic and conversion campaigns, and app installs:
- Cost of Acquiring a Customer (CAC): TikTok won't give you this number, but as we repeatedly mention, CAC is the most important metric that tells you if a channel is profitable for you. The average CAC on TikTok is $35. Use this number as a benchmark to begin running ads and getting back data.
- Impressions, eCPM & eCPV: number of times your ad was seen, cost per 1,000 views, and the average cost per video view (two seconds or more).
- Average Watch Time: average length of time people spend watching your ads.
- Completions: number of times your video ad was played at 25%, 50%, 75%, or 100% of its length.
- Cost Per Action (CPA): the average amount of money you've spent on a conversion. E.g., If you're optimizing for email signups, a CPA of 3 tells you that it costs $3 per signup.
- Add to Cart & Initiate Checkout: The total number of times someone added an item to their cart or started a checkout.
- ROAS (return on ad spend): The total dollars driven in your app or website from your campaigns relative to your media spend.
- Amount spent: total amount spent on the campaign to date.
- Installs, Install rate, and eCPI: The number of app installs, the percentage of clicks that drove installs, and the effective cost per app install.
Attribution and iOS 14+
iOS 14 has made attribution reporting a significant challenge for all advertisers. It’s hard to say to what extent this will affect TikTok, but it’s something to be aware of nevertheless.
In a nutshell: Apple’s new App Tracking Transparency framework (ATT) requires users to opt-in to tracking across apps and websites owned by other companies. ATT as a privacy policy has the potential to cause significant data loss, which then leads to underreporting in your ads manager. Advertisers can expect lower performance metrics (i.e., partial or limited data for anything beyond a 1-day click) and likely inaccurate ROAS reporting, but nobody quite knows the full extent of it...
So that’s the broader issue. Now here’s our read on it: If you’re advertising on TikTok (ideal for products with short sales cycles and impulse buys), you’re generally limited to a single-session attribution window by default, which minimizes the risk of IOS 14-induced data loss. For more details on the impact of iOS 14 on TikTok ads, here is the official TikTok documentation.
And for those concerned, here are a few workarounds to help hedge against potential ATT data loss:
- Use post-purchase surveys to gut-check models with multiple touchpoints, as delayed clicks and view-based conversions are less likely to be credited.
- Use dedicated TikTok coupon codes (e.g., TIKTOK15) to track TikTok customer acquisition.
- Use UTM parameters in your links and track data across platforms (we show you how to do this in the Project module next).
- Sign up for third-party analytics tools like Supermetrics or Rockerbox and aggregate the data there.
- Build a blended ROAS dashboard:
- Many advertisers now use blended ROAS as their Holy Grail metric.
- Blended ROAS = total daily revenue divided by total ad spend on all channels.
- Instead of relying on in-app ROAS, which can be inaccurate or delayed, a blended metric gives you a holistic view of ROI; it tells you how much you're spending on marketing, how much revenue is coming in, and whether the ratio is profitable or not. 2 - 4x is a good blended ROAS target to aim for, depending on AOV.
- For simple setups (~1-3 channels): use Two Minute Reports to build a simple, automated spreadsheet that pipes in your data from multiple channels to keep track of daily blended ROAS.
- For more complicated setups (3+ channels, offline tracking needs): Sign up for a service like Supermetrics. It's more expensive than Two Minute Reports, but it's a small investment for clean and reliable data analysis if your business is complicated.