Conversation


🥳 Feedback Received!
Thanks for taking a moment to share your thoughts — it genuinely helps us make each chapter sharper.
What happens next:
- Your feedback goes straight to our product team.
- We’ll use it to refine lessons, clarify examples, and make the program even more useful.
Appreciate you helping make this program better for everyone.
Ready for your next challenge? 👇
How to Measure and Test Ad Performance
We'll cover how to measure and test your ads' performance in this lesson. Before diving in, though, we first recommend customizing your default ads dashboard and creating custom performance metrics in Meta Ads Manager. We advise doing this because the default performance view in Ads Manager isn’t very actionable.
First, here's how to create custom metrics. (We'll create a few custom ones for your new default view.)
- In Meta Ads Manager, navigate to the Ads Reporting page, and click Customize.
- Select the Metrics tab. Scroll down to Custom Metrics, where any custom metrics you've created are listed.
- Click the Create button to fill out a custom metric creation form. You'll then need to complete the form, name your metric, and click Create Metric.
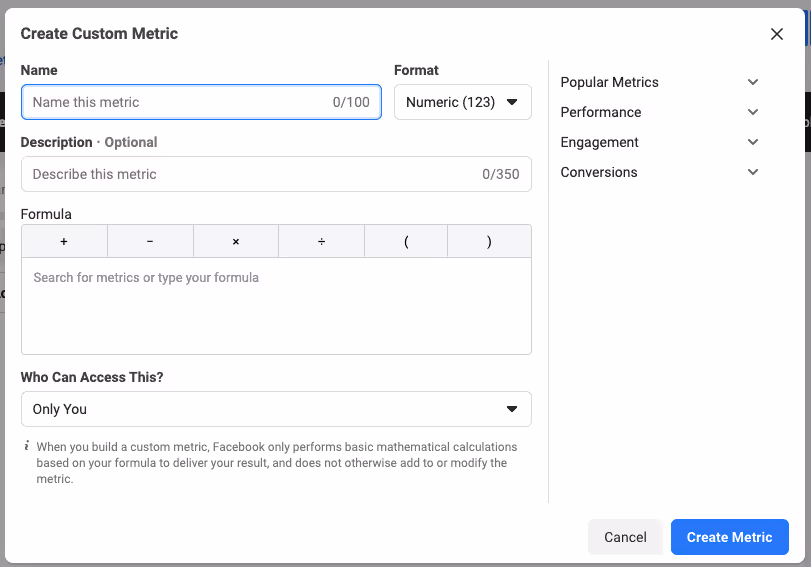
What custom metrics should you create? For a more detailed look at your ads' performance, we suggest these four:
- Average order value: The average amount spent by a customer. Use a numeric format and calculate this as website purchases conversion value divided by website purchases.
- Add to cart to purchase ratio: The rate of users who added something to their cart and completed their purchase. Use a percentage format and calculate this as website purchases divided by adds to cart.
- Goal conversion rate: A custom measure based on your desired conversion goal. For example, if your goal is to get more lead signups, you can set this metric as the number of signups divided by total ad reach.
- Thumb stop rate: A measure of whether ads grab users’ attention in their feed (by getting their thumb to stop scrolling). Use a percentage format and calculate this as 3-second video plays divided by impressions.
Once you've finished creating these custom metrics, customize your default ads view.
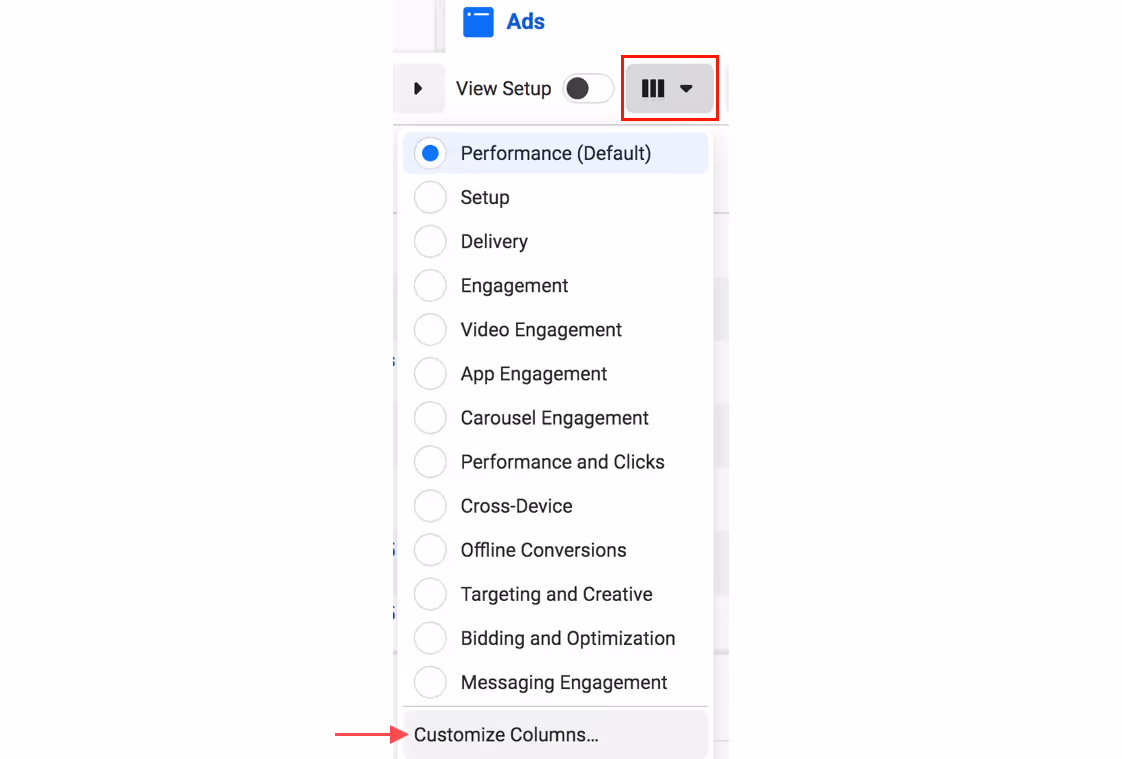
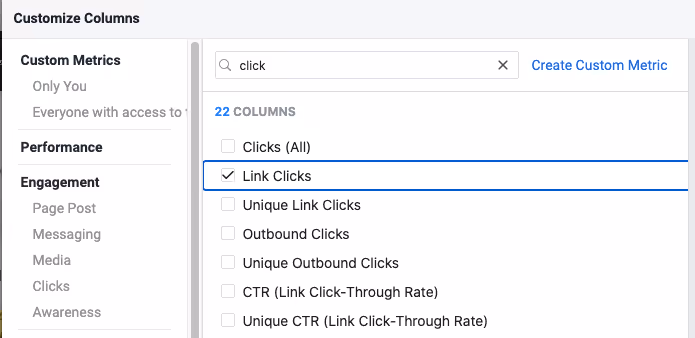
- Navigate to Meta Ads Manager. Click on the Columns icon, which looks like three vertically oriented rectangles. Click Customize Columns at the bottom of the menu.
2. A Customize Columns window will appear, showing your dashboard's current data columns and others you can add. Check and uncheck the boxes of the metrics that you want to appear in your dashboard, including your custom metrics. (We'll give specific recommendations about which metrics to include after this.)
3. Once complete, click the Apply button at the bottom of the Customize Columns window. The columns you've specified will now show up in Ads Manager.
4. Click the Columns icon again. Save and name your custom view. Then click Set as Default.
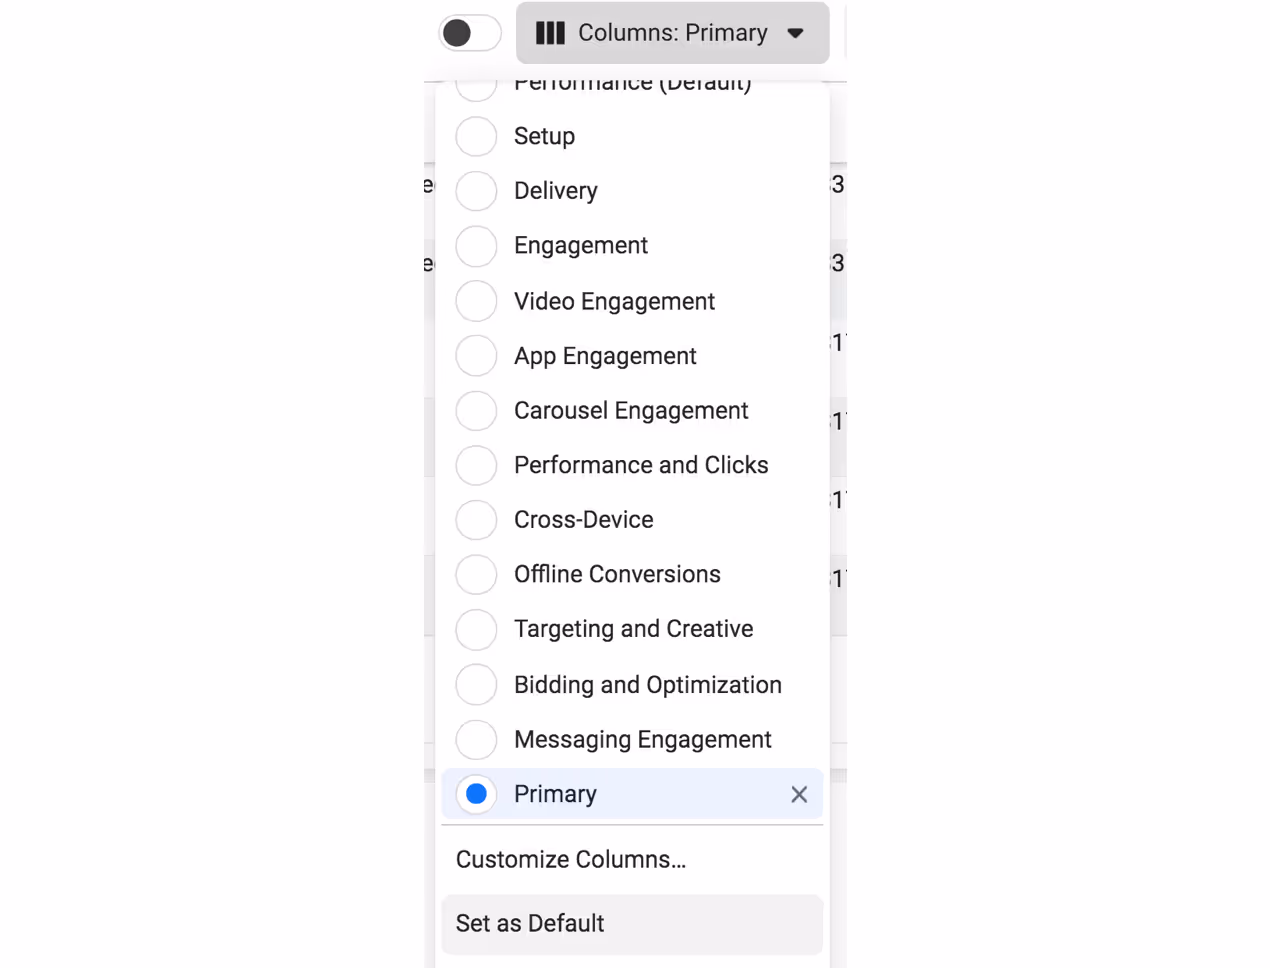
Now, every time you open Ads Manager, your default view will be updated with the metrics you've checked.
Which metrics should you include? For a high-level view of your account’s health, we recommend:
- Campaign/Ad set name: For easy sorting and identification purposes.
- Delivery: This metric tells you if any of your ads have been rejected. Meta will usually tell you why, e.g., too much text, inappropriate content, etc.
- Budget: How much your ads can spend per day.
- Amount spent: How much you’ve spent over the time period you’re looking at.
- Results: This is Meta's version of conversions—it uses the term "results" since not all campaign objectives are necessarily conversion-focused.
- Cost per result: One of the most important metrics for judging your ads' effectiveness, this tells you how much you paid per ad per conversion.
- Link clicks: This refers to your ads' clickthrough rate, the number of users actually clicking on your ad.
- Reach: How many distinct people saw your ad (any number of times). We generally advise letting your ads reach at least 1,200 before drawing any conclusions about your data.
- CPM (Cost per 1,000 impressions): Use this metric to understand how competitive your audience is.
- Frequency: How many times each reached person has seen your ad. This metric is important for avoiding ad fatigue. Ideally, users shouldn't see your ad more than twice in a very short time frame (like less than a week).
- Goal conversion rate: Create this custom metric based on your campaign's exact goals, e.g., email signup or purchase. Use it to understand whether people are taking action from your ad.
AIDA framework
To understand how your ad creatives are doing, we recommend creating another custom dashboard view in Ads Manager with metrics from the AIDA framework. The AIDA framework describes how users decide whether or not to buy something, separated into four stages. Apply this framework to your ad creatives to gauge their effectiveness:
- Attention: Does your ad grab people’s attention? Look at its thumb stop rate, a custom metric showing how often users will pause on an ad. The thumb stop rate tells you if your ad’s hook was enticing enough to get users to stop scrolling.
- Aim for at least 10%; the higher, the better. We’ve seen thumb stop rates as high as 57%.
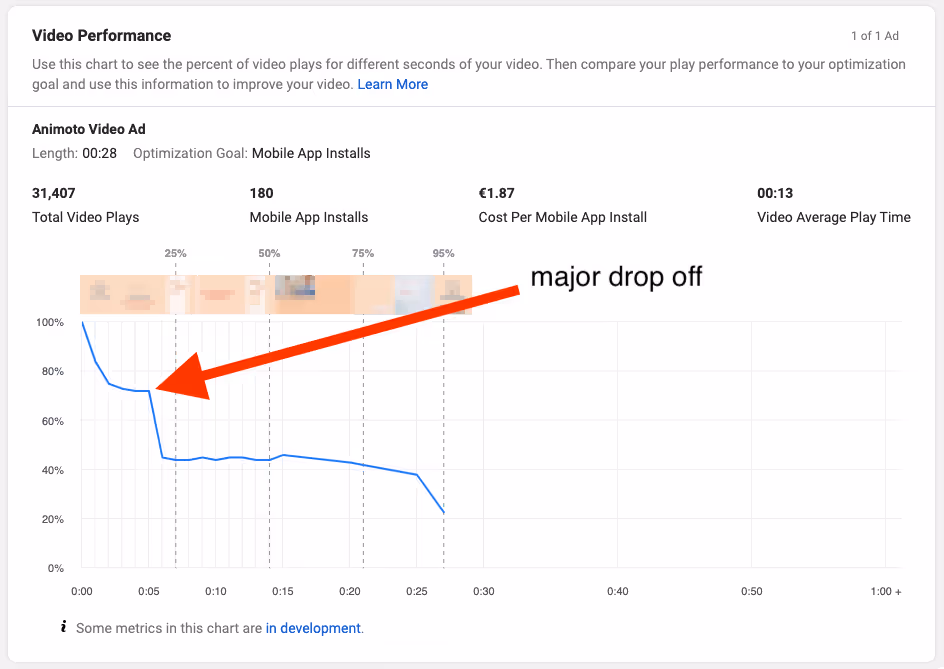
- Interest: Does your ad sustain people’s attention? This stage is most applicable to video and carousel ads because there’s no good metric for evaluating static image ads. Gauge people’s interest by looking at video average play time or carousel engagement.
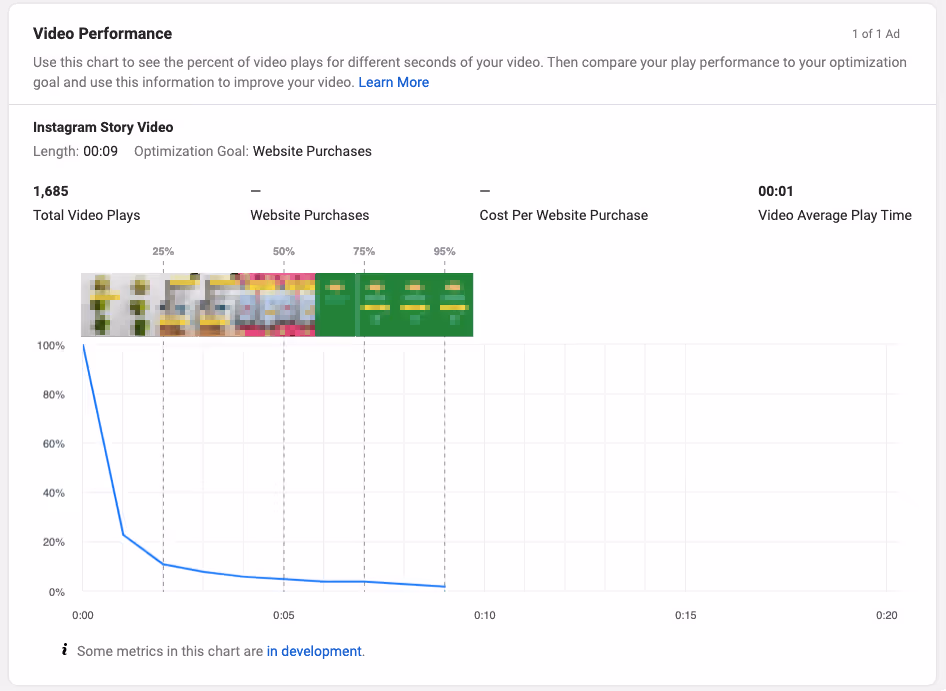
- Also look at your video ads’ drop-off data to find out at what point users stop watching your video ad. This will give you an idea of how much information they’ve gotten through. You can find this data by clicking the View Charts option of any video ad listed in Ads Manager. This will take you to the Performance Overview page; scroll down to find the Video Performance chart. Note that your video ad needs a minimum of 1,000 plays in order to display this data.
- In the example below, most users drop off after the first second—so it’s no wonder this ad hasn’t gotten any conversions.
- Desire: Does your ad make users want to learn more? Look at link clicks, Meta's version of clickthrough rate (CTR), to gauge your ad’s effectiveness here.
- Meta offers several different CTRs, which include clicks to your Facebook/Instagram page and clicks on something other than your CTA. We recommend looking at link clicks specifically because it looks only at clicks on your CTA button.
- Meta offers several different CTRs, which include clicks to your Facebook/Instagram page and clicks on something other than your CTA. We recommend looking at link clicks specifically because it looks only at clicks on your CTA button.
4. Action: Do users convert after seeing your ad? The cost per result metric, which is Meta's version of CPA, measures the amount spent per whatever conversion chosen for your ad objective, like purchase or app install.
- Cost per result also helps gauge whether Meta ads are a sustainable acquisition channel based on your margin. We recommend budgeting a number no more than ⅓ of your customer LTV.
- Example: If your customer LTV is $150, you should aim for a $50 cost per result. Use the rest of the AIDA framework to test and improve upon different aspects of your ad creatives to reach this target—we’ll cover testing in more detail next.
How to test ad creatives
We didn’t give benchmarks for every AIDA metric earlier because every business is different. There’s rarely a universal benchmark to measure your ads against—having one might even mislead you to think an ad is performing better than it really is, or vice versa.
So how do you know which ads are actually working?
Many people look only at an ad’s cost per result, but really, they should look at each metric outlined in the AIDA framework. This data tells you which aspects of an ad need improvement.
Starting out, use your first few ads to establish a baseline of ad performance for each of your AIDA metrics. You should be testing multiple ads at once, not just one at a time. Compare each of the metrics to see which ads are performing well or poorly. For example, you may find that one video ad has a very high link CTR; this may mean your other ads need more improvement in the desire stage.
Finding a target threshold to aim for with each metric will be specific to your company. This is a learning process based on continually comparing your ads against one another.
Here are some ideas for improving your ads based on data:
- For video ads with a low thumb stop rate (under 10%), reevaluate the first frame. Try a different hook to keep users from scrolling past.
- From our experience, creating an enticing hook is where most companies struggle. For video ads, make your first 3 seconds pop. For static image ads, use a top-down approach so that the most important elements appear first.
- Look at your video ads’ drop-off data and map the biggest drop-off points in your video. What happens at those points? Is it after the first cut? Is there a long headline? Maybe your ad took too long to get to the point.
- If an ad’s CTR is low, it may not be creating enough desire in users. Try a different CTA—or a different offer altogether. For example, offer a free trial instead of a discount code.
- If conversion rates are low, revisit your ad landing page. Does it accurately build on your ad? For example, if you’re advertising a free gift, you shouldn’t direct users to the homepage; instead, take them to a page with instructions for redeeming that gift.
- More broadly, continue the same messaging used in your ad on your landing page. Vidyard does that by featuring the same characters in both its video ad and landing page so that the page feels like an extension of the same story.


- Alternatively, if conversion rates are low, consider revisiting your signup or order form, whatever process users have to go through to convert. Can it be made shorter to reduce friction?
Experiment with radically different concepts, especially if you’re not seeing many conversions. This also applies to ad format; if you’ve only used static images, try video, and vice versa. Trying very different creatives will give you a wider sample of data to learn from. Consider how BambooHR runs both video and static image ads with very different creatives and copy.

Also don’t wait for Meta's learning phase to finish to decide whether to keep running a particular ad. The recommendation to reach 50 conversions isn’t one-size-fits-all and will inevitably vary for different industries and products. Your goal is to determine if an ad works for a given moment in time by comparing it against others within the same ad set. Pause underperforming ads—those with the highest cost per result, getting the fewest clicks, etc.
This doesn't mean your lowest-performing ads should be turned off forever, though. You should relaunch them again later. Meta's algorithm uses an auction system to deliver ads; this means your ads are always competing against other advertisers’. You need to test them repeatedly to find out what works best at any given point in time—don’t discount your ads based on a single period of testing.
Many advertisers think the goal of testing is finding out which of your ads is objectively the best—but this isn’t the right mindset for Meta. Instead, find out what Meta's algorithm likes at this specific moment.
Testing your ads is an ongoing process, but over time, you’ll notice trends. The goal is to find a winning ad concept and then optimize your targeting settings based on this data. This will lower your ad spend and make your ads more efficient.
Don’t expect today’s top-performing ad to work as well six months from now. Winning ad concepts get saturated with ad spend over time. Their target audience sees them, reacts, and then moves on because competitors are doing the same thing and the ad is no longer so compelling.
For continuous results with Meta ads, you’ll need to constantly develop new creatives and test them—then optimize them based on their performance.