Conversion Tracking Tools
This reading covers the tools we recommend to track conversions.
Analytics Platforms
These tools record data for every visitor to your site/app, including:
- Where they came from
- How long they stayed
- The pages they visited, and the order they visited them in
- Where in your funnel they dropped off
- Their device type and location
- The actions they performed
- And more!
Analytics platforms give you a great idea of how visitors interact with your site and where they’re coming from. They’re the foundation of every modern marketing team.
Google Analytics (GA)
GA is the most common analytics tool out there. It has tons of features. And it’s free. It also integrates with nearly every tool and platform.
You absolutely should install GA into your site or app if it’s not there already. We’ll be using it as the primary analytics software throughout this course.
GA is best for looking at site traffic as a whole. For example, you can see when groups of people click an ad or click around your homepage, broken down by geography or source.
Google Analytics 4, the current version of GA, also automatically tracks a variety of events such as clicks, scrolls, downloads, and searches.
Up until Google Analytics 4, GA was very bad at tracking conversions. Previously, if someone returned to your website/app on their computer after visiting on their mobile device, GA couldn't tell that it was the same person.
However, with Google Analytics 4, you can track users just like you can with the tools discussed in the next section. However, you need to explicitly set it up to do that by passing a unique ID or email address to GA along with your events.
Google Analytics is completely free, and the tools below can be very expensive. However, the other tools do have better reporting tools (in our opinion).
Although we won't cover it much in the program, let's learn more about user-level tracking.
User-level Tracking Platforms
We won’t get too into the weeds on these since we only recommend them if your site is complex or your sales cycle is long, and Google Analytics 4 doesn't suit your needs.
Platforms
A few event tracking platforms are on the market, including Mixpanel, Heap, and Amplitude. Any of them work.
If you’re starting from scratch, we recommend Mixpanel as it's by far the cheapest. It also integrates nicely with Zapier which helps cut down on engineering resources.
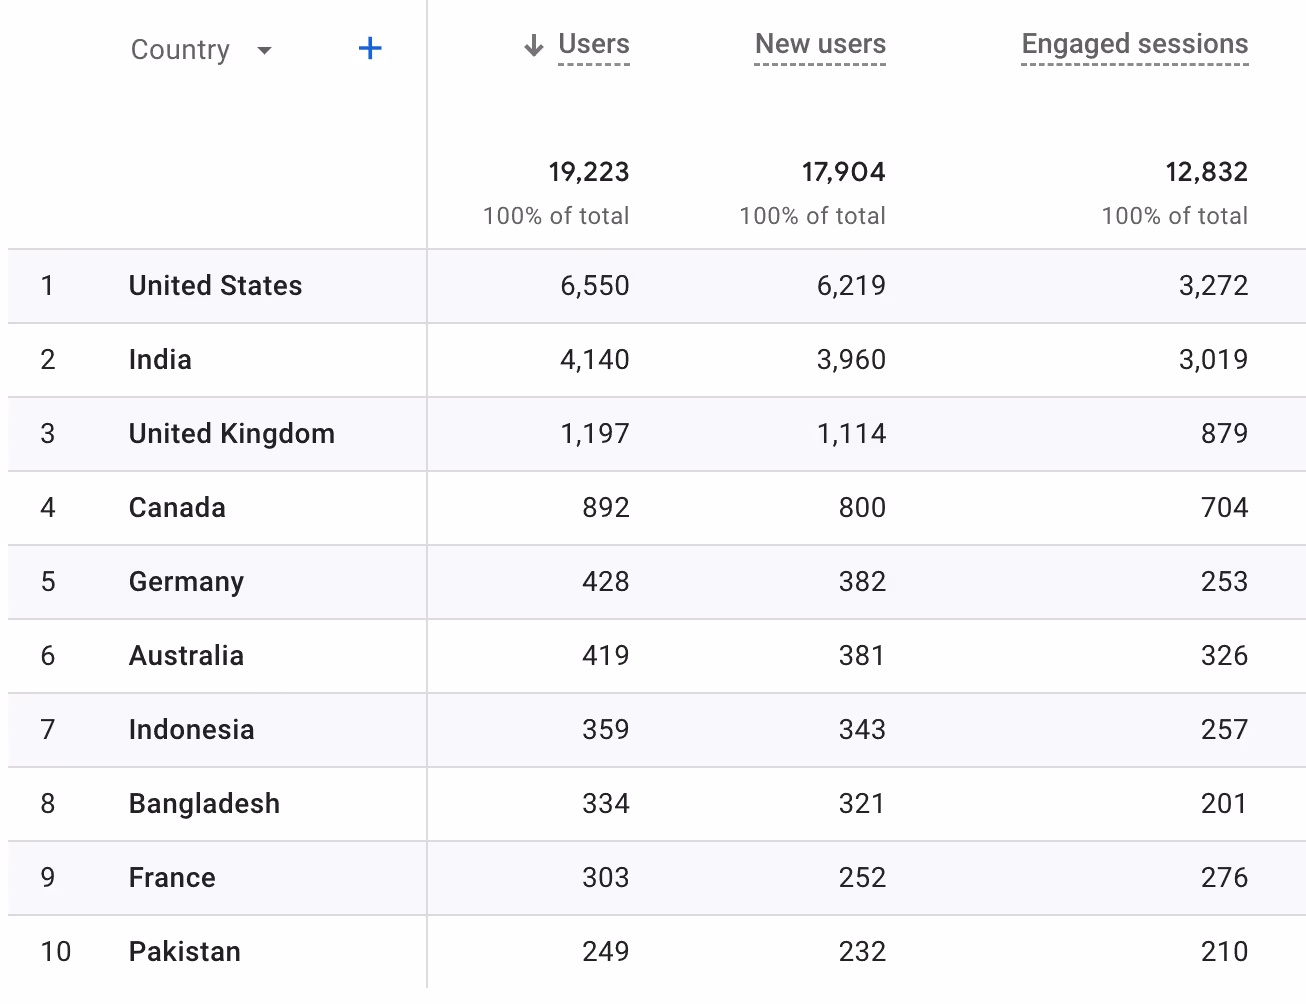
Screenshot
Here's an example of what you can see with Mixpanel data.

Who they’re best for
These platforms are best for medium-sized to large companies because they’re pretty expensive. They’re also good for complex web and/or mobile apps (especially if you have both a web and mobile version), or a long sales cycle.
If you’re an ecommerce company, or have a relatively simple site, these tools can be overkill. And they’re generally not appropriate for sites that don’t make users sign up.
How they work
Before Google Analytics 4 (and by default, unless you configure user-level tracking), GA tracked users on your site using “cookies,” which is how your browser knows they’re the same person every time they come back to your site.
If the user changed the device they use, changed their browser, used incognito mode, didn't allow cookies, or cleared cookies (which happens after a certain amount of time), then GA considered them a new person. This made down-funnel attribution difficult in GA, since people often change devices at least once (mobile → desktop, or home computer → work computer).
Instead of using cookies, user-level tracking platforms, and Google Analytics 4 (assuming you configure it) tie every action to the user using a unique identifier (often an email address, username, or database ID). If the user is signed into your site, all the actions they take will be associated to them—no matter what device or browser they’re using.
Integration Tools
If you are tracking a bunch of different events (Lead, Add to Cart, Initiate Checkout, etc etc) across a bunch of different channels/tools (Google, Facebook, Mixpanel, Intercom, email tool, HubSpot, etc) it can get really tedious (and error prone) logging each event for each tool.
Setting everything up in one place gives you the following benefits:
- You don’t have to write code. For some third-party tools, you can just copy-paste the tool’s code. For others, you don’t need to look at code at all.
- Your site’s code stays cleaner. You work through a website instead of a codebase.
- It saves your dev team a lot of time. Often, you won’t need to touch code at all or involve an engineer.
- You don’t risk adding bugs code. So your app won’t break. Instead, a tool that’s well-tested (and has a lot at stake if things go wrong) handles everything for you.
What are example integration tools?
- Segment: It's a powerful tool that lets you log events and users once and send that data to a variety of other tools. For example, Segment pumps all events from our website, course site, server, and email tool into Mixpanel/Amplitude and our email tool so we can see everything that's happening. It's the easiest to use and saves a lot of engineering time. It costs money, though, if you have more than 1,000 monthly visitors. We
- Google Tag Manager: A free tool from Google that helps non-programmers add bits of code (like conversion tracking scripts) to their site based on triggers. It is free but less powerful and involves much more manual work to set up than Segment. But for a lot of simpler businesses, it's all you need to get going.
Database Visualization Tools
We won’t talk much about database visualization tools in this module. We only recommend them if your site is complex and/or your sales cycle is long. Or if you don’t want to pay for user-level tracking.
What they are
These tools let you look at tables and graphs of the data you’ve recorded on your site. You can get super custom about the way you track users.
To make them most useful, you save almost everything about your users and their actions in your database or a "data warehouse." Then, these tools let you drill down into the data to create dashboards and visualizations for them.
Besides tables and graphs, you can also ask questions of the data, like:
- Who hasn’t purchased in +90 days?
- What traffic sources lead to my most engaged users?
- Where do my most engaged users live?
- What job titles do my paying users have?
- How big are the companies paying for my product?
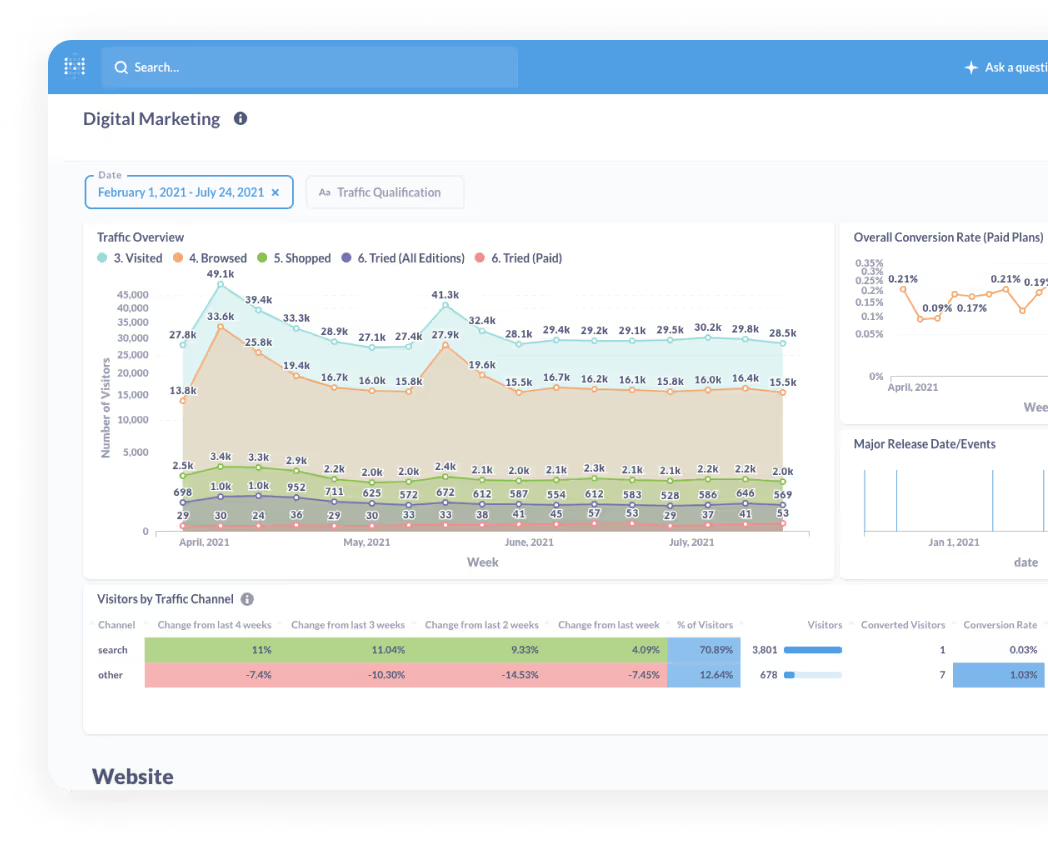
There are a few choices for these tools. Metabase, Mode, Looker, and Chartio are a few examples. They can cost hundreds of dollars per month.
Screenshots
Here’s a screenshot from Metabase's website so you can see with database visualization tools and why they’re useful.